
Java Troubleshooting Guide for HP-UX Systems
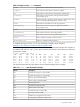
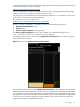
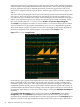
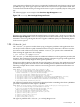
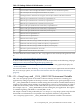

Table 1-15 Garbage Collection Field Information (continued)
Information in FieldField
GC invocation. Counts of background CMS GCs and other GCs are maintained separately.4
Size of the object allocation request that forced the GC, in bytes.5
Tenuring threshold—determines how long the newborn object remains in the New Generation.6
Eden Sub-space (within the New Generation) occupied before GC.7
Eden Sub-space (within the New Generation) occupied after GC.8
Eden Sub-space (within the New Generation) current capacity.9
Survivor Sub-space (within the New Generation) occupied before GC.10
Survivor Sub-space (within the New Generation) occupied after GC.11
Survivor Sub-space (within the New Generation) current capacity.12
Old Generation occupied before GC.13
Old Generation occupied after GC.14
Old Generation current capacity.15
Permanent Generation (storage of Reflective Objects) occupied before GC.16
Permanent Generation (storage of Reflective Objects) occupied after GC.17
Permanent Generation (storage of Reflective Objects) current capacity.18
The total stop-the-world duration, in seconds.19
The total time used in collection, in seconds.20
For more details about these fields, use the :help option or refer to the Java Programmers Guide
at:
http://docs.hp.com/en/JAVAPROGUIDE/index.html
To better understand how garbage collection works in the Java VM, see the following webpage:
http://java.sun.com/javase/technologies/hotspot/gc/index.jsp
Additionally, HP recommends using the HPjmeter tool, which can graphically display the
-Xverbosegc data.
For more information about obtaining -Xverbosegc data for Java applications started without
the -Xverbosegc option, see “Allocation Site Statistics and Zero Preparation Xverbosegc”
(page 51).
1.26 -XX:+HeapDump and _JAVA_HEAPDUMP Environment Variable
The -XX:+HeapDump option can be used to observe memory allocation in a running Java
application by taking snapshots of the heap over time. Another way to get heap dumps is to use
the _JAVA_HEAPDUMP environment variable; setting this environment variable enables memory
snapshots to be taken without making any modifications to the Java command line. In order to
enable this functionality, either use the command-line option or set the environment variable
(for example, export _JAVA_HEAPDUMP=1) before starting the Java application. This option
is available beginning with SDK 1.4.2.10 and JDK 1.5.0.03.
The output is similar to that produced by the -Xrunhprof:heap=dump option except that the
thread and trace information is not printed to the output file; therefore, using either the
-XX:+HeapDump option or the _JAVA_HEAPDUMP environment variable is less intrusive.
1.26 -XX:+HeapDump and _JAVA_HEAPDUMP Environment Variable 47