
Java Troubleshooting Guide for HP-UX Systems
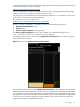
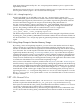

The bottom panel shows a graphical view of the spaces that make up the generational garbage
collection system. This panel is divided into three vertical sections, one for each of the generations:
the Perm generation, the Old (or Tenured) generation, and the Young generation. The Young
generation is comprised of three separate spaces, the Eden space, and two Survivor spaces, S0
and S1.
The screen areas representing the various spaces are sized in proportion to the maximum capacities
of the spaces. The screen areas for the three GC generations are of fixed size and do not vary
over time. Each space is filled with a unique color indicating the current utilization of the space
relative to its maximum capacity. The unique color for each space is used consistently among
this screen and the other two visualgc screens (Graph and Survivor Age Histogram).
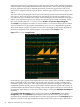
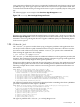
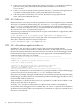
The Graph screen displays the values of various statistics as a function of time. The resolution
of the horizontal axis of the graph is determined by the interval command-line argument,
where each sample occupies two pixels of screen area. The height of each display depends on
the metric being plotted. The following figure is an example of the Graph screen:
Figure 1-17 visualgc Graph Screen
Each of the GC space graphs can be displayed in one of two modes: reserved mode or committed
mode; committed mode is the default. In reserved mode, the data is scaled according to the
maximum capacity of the space. The background grid is painted in dark gray to represent the
uncommitted portion and in green to represent the committed portion of reserved memory. In
committed mode, the data is scaled according to the current capacity of the space. The mode can
be toggled by right-clicking over the space and checking or clearing the Show Reserved Space
check box.
The Survivor Age Histogram screen consist of two panels, the Parameters panel and the
Histogram panel. The Parameters panel displays the size of the survivor spaces and the
parameters that control the promotion behavior of the young generation. The Histogram panel
displays a snapshot of the age distribution of objects in the active survivor space after the last
44 Diagnostic and Monitoring Tools and Options