
Java Troubleshooting Guide for HP-UX Systems

is not included in this set, but is instead provided in the unbundled jvmstat 3.0 distribution. The
download for jvmstat 3.0 may be found at:
http://java.sun.com/performance/jvmstat
visualgc attaches to a running Java VM processs to collect and graphically display garbage
collection, class loader, and Java compiler performance data.
The target Java VM is identified by its virtual machine identifier, or vmid. On HP-UX, the vmid
is the process id of the running Java application.
For details on visualgc usage refer to:
http://java.sun.com/performance/jvmstat/visualgc.html
When visualgc is attached to a running Java VM it opens the following screens:
1. Application Information screen
2. Graph screen
3. Survivor Age Histogram screen (optional)
The Survivor Age Histogram screen is only available when Parallel Scavenge is in use
(-XX:+UseParallelGC or -XX:+AggressiveHeap options).
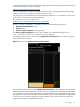
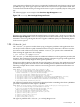
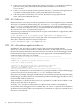
The following figure shows the visualgc Application Information screen and a description
of the different screen areas:
Figure 1-16 visualgc Application Information Screen
The top panel of this screen is labeled Application Information . This panel has an Alive/Dead
indicator and the elapsed time since the start of the Java application. Following this panel there
is a scrollable text area that lists miscellaneous information about the configuration of the target
Java application and the Java VM. This section includes main class or jar file name, the arguments
to the class's main method, arguments passed to the Java VM, and the values of certain Java
properties exported as instrumentation objects.
1.23 visualgc 43