
Java Troubleshooting Guide for HP-UX Systems
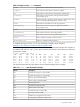

1.18 jstatd (1.5+ only)
The jstatd tool launches an RMI (remote method invocation) server that monitors the creation
and termination of Java VMs and provides an interface to enable remote monitoring tools to
attach to Java VMs running on the local host.
For more information, refer to the following webpage:
http://java.sun.com/j2se/1.5.0/docs/tooldocs/share/jstatd.html
1.19 jvmstat Tools
The Java VM shipped with SDK 1.4.2 and later provides always-on instrumentation needed to
support monitoring tools and utilities.
As of JDK 1.5, the following subset of jvmstat tools is included with the JDK: jps (formerly
jvmps) , jstat (formerly jvmstat), and jstatd (formerly perfagent). The visualgc tool
is not included with JDK 1.5+, but is instead provided in the unbundled jvmstat 3.0 distribution.
For more details, refer to the following webpage:
http://java.sun.com/performance/jvmstat
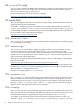
1.20 -verbose:class
The -verbose:class option displays information about each loaded class. It enables logging
of class loading and unloading.
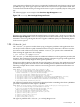
1.21 -verbose:gc
The -verbose:gc option enables logging of garbage collection (GC) information. It can be
combined with other Java VM specific options such as -XX:+PrintGCDetails and
-XX:+PrintGCTimeStamps to retrieve more information about the GC. The information output
includes the size of the generations before and after each GC, total size of the heap, the size of
objects promoted, and the time taken.
These options along with detailed information about GC analysis and tuning, are described at
Sun's GC portal site:
http://java.sun.com/developer/technicalArticles/Programming/GCPortal
The -verbose:gc option can be dynamically enabled at runtime using the management API
or JVMTI. The jconsole monitoring and management tool can also enable or disable this option
when attached to a management Java VM.
For other GC logging options, see -Xverbosegc.
1.22 -verbose:jni
The -verbose:jni option enables logging of Java Native Interface (JNI). Specifically, when a
JNI native method is resolved, the Java VM prints a trace message to the application console
(standard output). It also prints a trace message when a native method is registered using the
JNI RegisterNative() function. The -verbose:jni option may be useful when trying to
diagnose issues with applications that use native libraries.
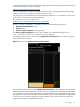
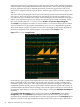
1.23 visualgc
The visualgc tool uses jvmstat technology to provide visualization of garbage collection activity
in the Java VM. The Java VM shipped with JDK 1.4.2 and later releases provides the always-on
instrumentation needed to support monitoring tools and utilities such as visualgc.
As of JDK 1.5+, the following subset of the jvmstat tools is included with the Java VM: jps
(formerly jvmps), jstat (formerly jvmstat), and jstatd (formerly perfagent). visualgc
42 Diagnostic and Monitoring Tools and Options