
Java Troubleshooting Guide for HP-UX Systems

1.7.1.2 Using HPjmeter to Analyze Garbage Collection Data
The following steps summarize how to collect and view garbage collection data from your
application:
1. When running on HP-UX, add the -Xverbosegc option to the Java command line. (On
non-HP-UX platforms, use the -Xloggc option instead.)
NOTE: On JDK 5.014 (or later) and JDK 6.0.02 (or later), the command-line option is not
required to capture Xverbosegc data. Instead, you can toggle Xverbosegc on and off by
sending a SIGPROF signal to JVM. For more information, see “Allocation Site Statistics and
Zero Preparation Xverbosegc” (page 51).
2. Run the application to create a data file.
3. Start the console from a local installation on your client machine. For example, here are two
different ways:
$ $JAVA_HOME/bin/java <heap_settings> -jar /opt/hpjmeter/lib/HPjmeter.jar
$ /opt/hpjmeter/bin/hpjmeter
4. Click File—>Open File to browse for and open the data file.
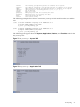
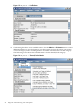
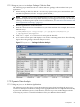
5. A GC viewer screen opens and displays a set of tabs containing metric data. The following
figure shows the garbage collection analysis screen:
Figure 1-7 HPjmeter — Garbage Collection Analysis
1.7.2 Dynamic Data Analysis
1.7.2.1 Using HPjmeter to Monitor Applications
The following steps show how to start the monitoring agent when launching the HPjmeter
console. For most Java installations, linkage to the appropriate libraries is completed automatically
as part of the installation process, and, therefore, the first step is not needed. Begin with the
second step if you have a standard installation of the Java Runtime Environment.
1.7 HPjmeter 29