
Java Troubleshooting Guide for HP-UX Systems
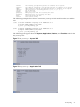
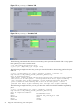
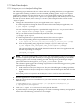
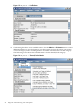
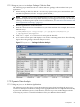
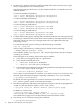

Figure 1-5 HPjmeter — Profile Data
6. Click among the tabs to view available metrics. Use the Metrics or Estimate menus to select
additional metrics to view. Each metric you select opens in a new tab. Hover your mouse
over each category in the cascading menu to reveal the relevant metrics for that category.
The following screen shows the available metrics for the threads/locks category:
Figure 1-6 HPjmeter — Threads/Locks Metrics
28 Diagnostic and Monitoring Tools and Options