
Java Troubleshooting Guide for HP-UX Systems

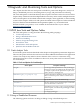
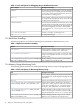
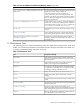
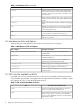
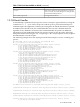
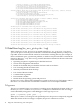
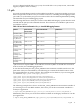
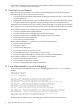

Table 1-5 Performance Tools (continued)
Description and UsageTool
Displays statistics for network interfaces and protocols
as well as the contents of various network-related data
structures. It can show packet traffic, connections, error
rates, and more.
netstat
Report various system activities, such as processor, I/O,
context switches, interrupts, page faults, and other kernel
actions.
sar
Displays information about device and file-system-paging
space.
swapinfo
Displays the top processes on the system, periodically
updating the information; raw processor percentage is
used to rank the processes.
top
Provides another view into the system activity, in addition
to Java stack traces, GlancePlus, and HPjmeter.
tusc
Reports statistics about the process, virtual memory, trap,
and processor activity.
vmstat
1.1.6 Miscellaneous Tools and Options
The following tools and options do not fall into any of the previous categories:
Table 1-6 Miscellaneous Tools and Options
Description and UsageTool or Option
Used to augment the options specified in the Java
command line.
JAVA_TOOL_OPTIONS Environment Variable
Tools include jps, jstat, and jstatd. These tools are
included with JDK 1.5+.
jvmstat Tools
Uses jvmstat technology to provide visualization of
garbage collection activity in the Java VM.
visualgc
Enables logging of class loading and unloading.
-verbose:class
Enables logging of JNI (Java Native Interface).
-verbose:jni
Performs additional validation on the arguments passed
to JNI functions.
-Xcheck:jni
1.1.7 JDK Tools Not Available on HP-UX
Some JDK tools are not available on HP-UX, so they are not described in this document. They
are provided in JavaSoft JDK as unsupported tools. Equivalent functionality is available via gdb
Java support, HPjmeter, and the HeapDump options.
Table 1-7 JDK Tools Not Available on HP-UX
Description and HP-UX AlternativeTool
Prints Java configuration information for a given Java
process, core file, or remote debug server.
jinfo
Prints shared object memory maps or Java heap memory
details of a given process, core file, or remote debug
server. Use the HeapDump options or gdb heap dump
functionality instead.
jmap
16 Diagnostic and Monitoring Tools and Options