
Java Troubleshooting Guide for HP-UX Systems

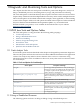
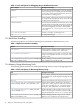
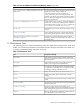
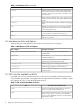
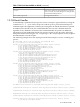
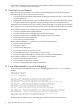

Table 1-4 Tools and Options for Monitoring Memory Usage (continued)
Description and UsageTool
Used to enable heap dumps using the SIGVTALRM signal
(signal 20). It can be set by providing the
-XX:+HeapDumpOnly option or setting the
_JAVA_HEAPDUMP_ONLY environment variable. This
interface is provided to separate the generation of thread
and trace information triggered via SIGQUIT from the
heap dump information.
-XX:+HeapDumpOnly, starting with JDK 1.5.0.05 and
SDK 1.4.2.11
Used to enable logging of garbage collection information.
The HP-only -Xverbosegc option generates additional
GC information that is used by HPjtune. It is preferable
to use -Xverbosegc instead of -verbose:gc.
-Xverbosegc (HP only) and -verbose:gc
This third-party tool may be used to perform Java heap
analysis.
hat or jhat
Used to monitor and manage an application launched
with a management agent on a local or remote machine.
jconsole (1.5+ only)
Prompts the Java Virtual Machine (JVM) to emit HP
Xverbosegc information and allocation site statistics for
Java applications.
“Allocation Site Statistics and Zero Preparation
Xverbosegc” (page 51)
1.1.5 Performance Tools
The following tools are useful for identifying where the application spends its time. Some tools
enable you to monitor performance in real time (dynamic analysis) and other tools enable you
to analyze captured profiling data (static analysis):
Table 1-5 Performance Tools
Description and UsageTool
Easily examine system activities, identify and resolve
performance bottlenecks, and tune your system for more
efficient operation.
GlancePlus
Understand the execution of your applications and
identify ways to improve their performance.
HP Caliper
Use statically collected eprof data to understand where
the application is spending time. Use dynamic real-time
monitoring to identify performance issues.
HPjmeter
HPjtune functionality has been integrated into HPjmeterHPjtune
Simple static profiler agent used for heap and CPU
profiling.
hprof
Iteratively reports I/O statistics for each active disk on the
system.
iostat
Attaches to the Java VM and collects and logs performance
statistics dynamically.
jstat (1.5+ only)
Launches a simple console tool enabling you to
dynamically monitor and manage an application launched
with a management agent on a local or remote machine.
jconsole (1.5+ only)
Retrieve a profile of the compiled Java methods that the
Java VM compiler creates in data space.
Prospect
1.1 HP-UX Java Tools and Options Tables 15