Java™ Troubleshooting Guide for HP-UX Systems HP Part Number: 5992-4687 Published: April 2009 Edition: 4.
© Copyright 2009 Hewlett-Packard Development Company, L.P. Confidential computer software. Valid license from HP required for possession, use or copying. Consistent with FAR 12.211 and 12.212, Commercial Computer Software, Computer Software Documentation, and Technical Data for Commercial Items are licensed to the U.S. Government under vendor's standard commercial license. The information contained herein is subject to change without notice.
Table of Contents About This Guide...............................................................................................................9 Intended Audience.................................................................................................................................9 Publishing History..................................................................................................................................9 Locating This Guide................................................
1.21 -verbose:gc...............................................................................................................................42 1.22 -verbose:jni.............................................................................................................................42 1.23 visualgc......................................................................................................................................42 1.24 -Xcheck:jni ......................................................
4.1.2 StackTrace.java................................................................................................................66 4.1.3 stacktrace.c.......................................................................................................................67 4.2 Building the Application.................................................................................................................68 4.3 Verifying the Core File.................................................................
List of Figures 1-1 1-2 1-3 1-4 1-5 1-6 1-7 1-8 1-9 1-10 1-11 1-12 1-13 1-14 1-15 1-16 1-17 1-18 1-19 6 HPjconfig — System Tab..........................................................................................................23 HPjconfig — Application Tab...................................................................................................23 HPjconfig — Patches Tab.........................................................................................................
List of Tables 1-1 1-2 1-3 1-4 1-5 1-6 1-7 1-8 1-9 1-10 1-11 1-12 1-13 1-14 1-15 1-16 1-17 3-1 3-2 Tools and Options for Crash Analysis...........................................................................................13 Tools and Options for Debugging Hung or Deadlocked Processes..............................................14 Options for Fatal Error Handling..................................................................................................
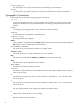
About This Guide This document describes how to use HP-UX Java diagnostic and monitoring tools, how to use system tools for Java troubleshooting, how to get additional help from Hewlett-Packard (HP), and how to analyze core files. Intended Audience This document is intended for application developers and support engineers who are debugging Java applications on HP-UX systems. Note that some features described in this document are only available on HP-UX systems.
Chapter 4 (page 65) Use this chapter as a step-by-step tutorial for performing core file analysis. Glossary Use the Glossary for a quick reference to HP-UX Java-related terms and their definitions. Typographic Conventions This document uses the following typographic conventions: %, $, or # A percent sign represents the C shell system prompt. A dollar sign represents the system prompt for the Bourne, Korn, and POSIX shells. A number sign represents the superuser prompt. audit(5) A manpage.
WARNING A warning calls attention to important information that if not understood or followed will result in nonrecoverable system problems. CAUTION A caution calls attention to important information that if not understood or followed will result in data loss, data corruption, or damage to hardware or software.
1 Diagnostic and Monitoring Tools and Options This chapter describes the tools and options available for postmortem diagnostics, analysis of hung or deadlocked processes, monitoring memory usage, and performance monitoring. The tools and options are listed in tables by their respective functions in the first section of this chapter. Many of them are listed in multiple tables because they can be used for multiple functions.
Table 1-2 Tools and Options for Debugging Hung or Deadlocked Processes Tool or Option Description and Usage wdb/gdb An HP-supported implementation of the gdb debugger that has Java support. For simplicity, this document refers to wdb/gdb as gdb from this point forward. gdb can be used to attach to a running process. HPjmeter Used to identify and diagnose performance problems in Java applications running on HP-UX. It can also be used to debug thread and heap issues.
Table 1-4 Tools and Options for Monitoring Memory Usage (continued) Tool Description and Usage -XX:+HeapDumpOnly, starting with JDK 1.5.0.05 and SDK 1.4.2.11 Used to enable heap dumps using the SIGVTALRM signal (signal 20). It can be set by providing the -XX:+HeapDumpOnly option or setting the _JAVA_HEAPDUMP_ONLY environment variable. This interface is provided to separate the generation of thread and trace information triggered via SIGQUIT from the heap dump information.
Table 1-5 Performance Tools (continued) Tool Description and Usage netstat Displays statistics for network interfaces and protocols as well as the contents of various network-related data structures. It can show packet traffic, connections, error rates, and more. sar Report various system activities, such as processor, I/O, context switches, interrupts, page faults, and other kernel actions. swapinfo Displays information about device and file-system-paging space.
Table 1-7 JDK Tools Not Available on HP-UX (continued) Tool Description and HP-UX Alternative jstack Prints a Java stack trace of Java threads for a given Java process, core file, or remote debug server. Use gdb stack trace back functionality instead. Serviceability Agent (SA) Not supported on HP-UX. 1.2 Ctrl-Break Handler A thread dump is printed if the Java process receives a SIGQUIT signal.
- waiting on <11000100> (a java.lang.ref.ReferenceQueue$Lock) at java.lang.ref.ReferenceQueue.remove(ReferenceQueue.java:133) - locked <11000100> (a java.lang.ref.ReferenceQueue$Lock) at java.lang.ref.ReferenceQueue.remove(ReferenceQueue.java:149) at java.lang.ref.Finalizer$FinalizerThread.run(Finalizer.java:197) "Reference Handler" daemon prio=10 tid=0052de80 nid=12 lwp_id=2669767 in Object.wait() [752c0000..752c0ce0] at java.lang.Object.wait(Native Method) - waiting on <11003dc8> (a java.lang.ref.
gcore is shipped with HP-UX 11i v3 (11.31). For an HP-UX 11i v2 (11.23) version, contact HP support (response center or WTEC). 1.5 gdb Java stack unwind enhancements have been added to enable it to support unwinding across Java frames and provide an effective way to examine stack traces containing mixed language frames (Java and C/C++) of both live Java processes and core files. This has been implemented by adding subcommands for Java VM debugging to gdb.
If the SDK is installed in a location other than the default, substitute the nondefault location for /opt/java1.4 in the previous commands. 1.5.1 Java Stack Unwind Features The Java stack unwind features are useful for troubleshooting problems in the Java Virtual Machine (VM).
Table 1-9 Java VM Debugging Commands backtrace Print backtrace of mixed Java and native frames info frame Print Java frame specific information if this is a Java frame info threads Print state information for all threads thread Print detailed state information for the current thread Table 1-10 Java Subcommands java args Show the current or specified Java frame arguments information java bytecodes Disassemble the given Java method's bytecodes java heap-histogram Show the Java heap object histogr
$ ps -u user1 | grep java 23989 pts/9 8:52 java • Attach gdb to the running process: $ gdb -p 23989 HP gdb 5.0 for HP Itanium (32 or 64 bit) and target HP-UX 11.2x. Copyright 1986 - 2001 Free Software Foundation, Inc. Hewlett-Packard Wildebeest 5.0 (based on GDB) is covered by the GNU General Public License. Type "show copying" to see the conditions to change it and/or distribute copies. Type "show warranty" for warranty/support. Reading symbols from /opt/java1.4/bin/IA64N/java...
-listmis -listpres -apply -javavers -[no]gui -logfile -proxyhost -proxyport -help -version list missing java-specific patches or tunables on the system list applied (installed) java-specific patches or tunables on the system apply (install) missing java-specific patches or tunables on the system java versions for selecting patches e.g 1.2, 1.3, 1.4, 5.
Figure 1-3 HPjconfig — Patches Tab Figure 1-4 HPjconfig — Tunables Tab The following commands show how to execute HPjconfig in non-GUI mode. The -help option lists options you can use in this mode. $ cd $ java -jar ./HPjconfig.jar -nogui -help The following example executes HPjconfig in non-GUI mode to list missing patches for Java SDK 1.4: $ java -jar HPjconfig.jar -nogui -patches -listmis -javavers 1.4 Log written to HPjconfig_mutant_20060915_040458.
maxfiles_lim maxdsiz 2*1024 2000*1024*1024 The following example uses HPjconfig to display tunables that are set to values less than those recommended: $ java -jar HPjconfig.jar -nogui -tunables -listmis Log written to HPjconfig_mutant_20060915_040955.
Table 1-11 HPjmeter 3.
1.7.1 Static Data Analysis 1.7.1.1 Using HPjmeter to Analyze Profiling Data The following steps summarize how to collect and view profiling data from your application. For applications running on HP-UX, use the extended profiling option -Xeprof to capture profile data, and then view the data in HPjmeter. For applications running on non-HP-UX platforms, you can use -Xrunhprof or -agentlib:hprof options, and use HPjmeter to view the data. (For more details, refer to thehprof section.
Figure 1-5 HPjmeter — Profile Data 6. Click among the tabs to view available metrics. Use the Metrics or Estimate menus to select additional metrics to view. Each metric you select opens in a new tab. Hover your mouse over each category in the cascading menu to reveal the relevant metrics for that category.
1.7.1.2 Using HPjmeter to Analyze Garbage Collection Data The following steps summarize how to collect and view garbage collection data from your application: 1. When running on HP-UX, add the -Xverbosegc option to the Java command line. (On non-HP-UX platforms, use the -Xloggc option instead.) NOTE: On JDK 5.014 (or later) and JDK 6.0.02 (or later), the command-line option is not required to capture Xverbosegc data. Instead, you can toggle Xverbosegc on and off by sending a SIGPROF signal to JVM.
1. Set the SHLIB_PATH environment variable to include the location of the HPjmeter agent library as appropriate for 32 or 64-bit Java VM. The following examples show how to set this variable in both the csh and the ksh for the different libraries. To select the PA-RISC 32-bit library: (csh) $ setenv SHLIB_PATH /opt/hpjmeter/lib/PA_RISC2.0 (ksh) $ export SHLIB_PATH=/opt/hpjmeter/lib/PA_RISC2.0 To select the PA-RISC 64-bit library: (csh) $ setenv SHLIB_PATH /opt/hpjmeter/lib/PA_RISC2.
1.7.2.2 Connecting to the Node Agent From the HPjmeter Console 1. Select Connect from the File menu or select the Connect to Server icon [ screen is displayed: ]. The following Figure 1-8 HPjmeter — Connecting to Server 2. 3. 4. In the Connect to Server dialog box, enter the host name where the Java application and corresponding node agent are running. If the node agent was started on a nonstandard port, specify the port number in the Optional Port box. Click Connect.
Figure 1-9 HPjmeter — Setting Session Preferences 2. 3. Check the default settings for metrics, filters, and alerts, and enable the settings you want to activate. Click OK. The Session Preferences screen closes and the newly Open Session is visible, marked by the icon. Refer to the following screen for an example: Figure 1-10 HPjmeter — Collecting Metrics 4. 32 Wait for the console to collect metrics.
1.7.2.4 Viewing Monitoring Metrics During Your Open Session 1. 2. Click the open session or time slice to highlight the data to be viewed. Use the Monitor menu on the console main screen to select the desired metrics. Refer to the following screen for an example: Figure 1-11 HPjmeter — Choosing Metrics to Monitor 3. Select a metric. A metric visualizer displaying the chosen data opens. Refer to the HPjmeter User’s Guide for details on individual metrics and how to interpret the data. 1.7.2.
1.7.2.5.1 Sample Memory Leak Application This application demonstrates how memory leak alerts work in HPjmeter. It uses a simple program which allocates some objects. The program uses a java.util.Vector object to retain references to some of the objects. This application is configured to leak memory at the rate of about 10 MB per hour. It is available from the HPjmeter installation directory: Source: $JMETER_HOME/demo/ML1.java Binary: $JMETER_HOME/demo/ML1.
Figure 1-13 HPjmeter — Heap Monitor Screen 1.7.2.5.2 Sample Thread Deadlock Application This application demonstrates how HPjmeter detects deadlocked threads. It creates pairs of threads every 30 seconds, stopping at 50 threads, which synchronize work using shared locks. Occasionally, the program reverses the order on which locks are taken, eventually causing a deadlock, which generates a Thread Deadlock Alert.
Figure 1-14 HPjmeter — Thread Histogram Screen 1.8 HPjtune NOTE: The HPjtune product has reached end of life. HP has integrated HPjtune functionality into HPjmeter 3.1 and recommends migrating to HPjmeter for the latest in bug fixes, enhancements, and support. 1.9 hat NOTE: Beginning with JDK 6.0, hat is replaced with jhat. For information on jhat, refer to the jhat section in this document. The hat tool is a third-party tool that can be used for heap analysis.
https://hat.dev.java.net/doc/README.html 1.10 hprof hprof is a simple profiler agent, which is shipped with the JDK, and used for heap and CPU profiling. Note that there can be very high intrusion due to the hprof agent. Therefore, when running on HP-UX, HP recommends using other profiling options first. (For example, use Xeprof for performance profiling and +HeapDump for heap profiling use.
at java.net.InetSocketAddress.(InetSocketAddress.java:124) at java.net.Socket.(Socket.java:178) at Test.main(Test.java:7) 1.12 JAVA_TOOL_OPTIONS Environment Variable The command line used to start an application is not always readily accessible in many environments. This is especially true with applications that use embedded Java VMs or ones where the startup is deeply nested in scripts.
1. 2. 3. Start the application with the -Dcom.sun.management.jmxremote option. This option sets the com.sun.management.jmxremote system property, which enables the JMX agent. Start jconsole with the jconsole command. When jconsole starts, it shows a screen listing the managed Java VMs on the machine. The process id (pid) and command line arguments for each Java VM are displayed. Select one of the Java VMs, and jconsole attaches to it. The following example shows invocation of jconsole.
heap dump file produced by one of the heap dump options such as -XX:+HeapDumpOnCtrlBreak or -Xrunhprof:heap=dump,format=b. The following example shows the use of jhat. The first command generates a binary heap dump file. The second command executes jhat on the binary heap profile. $ java -Xrunhprof:heap=dump,format=b MyApp $ jhat -port=7002 java.hprof The jhat tool sets up an http server on the specified port.
Table 1-13 Options to the jstat Command -class Prints statistics on the behavior of the class loader -compiler Prints statistics on the behavior of the Java compiler -gc Prints statistics on the behavior of the garbage collected heap -gccapacity Prints statistics of the capacities of the generations and their corresponding spaces -gccause Prints the summary of garbage collection statistics with the cause of the last and current (if applicable) garbage collection events -gcnew Prints statistics of
1.18 jstatd (1.5+ only) The jstatd tool launches an RMI (remote method invocation) server that monitors the creation and termination of Java VMs and provides an interface to enable remote monitoring tools to attach to Java VMs running on the local host. For more information, refer to the following webpage: http://java.sun.com/j2se/1.5.0/docs/tooldocs/share/jstatd.html 1.19 jvmstat Tools The Java VM shipped with SDK 1.4.
is not included in this set, but is instead provided in the unbundled jvmstat 3.0 distribution. The download for jvmstat 3.0 may be found at: http://java.sun.com/performance/jvmstat visualgc attaches to a running Java VM processs to collect and graphically display garbage collection, class loader, and Java compiler performance data. The target Java VM is identified by its virtual machine identifier, or vmid. On HP-UX, the vmid is the process id of the running Java application.
The bottom panel shows a graphical view of the spaces that make up the generational garbage collection system. This panel is divided into three vertical sections, one for each of the generations: the Perm generation, the Old (or Tenured) generation, and the Young generation. The Young generation is comprised of three separate spaces, the Eden space, and two Survivor spaces, S0 and S1. The screen areas representing the various spaces are sized in proportion to the maximum capacities of the spaces.
Young generation collection. The screen is comprised of 32 identically sized regions, one for each possible object age. Each region represents 100% of the active Survivor Space and is filled with a colored area that indicates the percentage of the survivor space occupied by objects of the given age.
• • • • • The JNI environment for the wrong thread is used An invalid JNI reference is used A reference to a nonarray type is provided to a function that requires an array type A nonstatic field ID is provided to a function that expects a static field ID A JNI call is made with an exception pending In general, all errors detected by -Xcheck:jni are fatal; the error is printed and the Java VM is aborted.
Table 1-15 Garbage Collection Field Information (continued) Field Information in Field 4 GC invocation. Counts of background CMS GCs and other GCs are maintained separately. 5 Size of the object allocation request that forced the GC, in bytes. 6 Tenuring threshold—determines how long the newborn object remains in the New Generation. 7 Eden Sub-space (within the New Generation) occupied before GC. 8 Eden Sub-space (within the New Generation) occupied after GC.
With the -XX:+HeapDump option enabled, each time the process is sent a SIGQUIT signal, the Java VM produces a snapshot of the Java heap in hprof ASCII format. The name of the file has the following format: java___
heap dump format generated by the -XX:+HeapDumpOnOutOfMemoryError option is the hprof binary format. One known issue exists: the-XX:+HeapDumpOnOutOfMemoryError option does not work with the low-pause collector (option -XX:+UseConcMarkSweepGC). 1.26.4 -XX:+HeapDumpOnly Starting with SDK 1.4.2.11 and JDK 1.5.0.05, the -XX:+HeapDumpOnly option or the _JAVA_HEAPDUMP_ONLY environment variable can be used to enable heap dumps using the SIGVTALRM signal (signal 20).
1. 2. 3. If the errfilename begins with the file separator character (“/”), it specifies an absolute path. The JAVA_CORE_DESTINATION environment variable is not used for the errfilename. If the errfilename contains the file separator character (“/”), but does not begin with one, it specifies a relative path ($JAVA_CORE_DESTINATION/errfilename). If no file separator is found in errfilename, the fatal error log is placed in the JAVA_CORE_DESTINATION directory. 1.
1.30 Allocation Site Statistics and Zero Preparation Xverbosegc IMPORTANT: The information in this section is supported on only JDK 5.0.14 (or later) and JDK 6.0.02 (or later) releases. Additionally, to properly view zero preparation Xverbosegc and allocation statistics information, you must use HPjmeter 3.1 (or later). For Java applications started without -Xverbosegc, you can prompt the Java Virtual Machine (JVM) to emit HP Xverbosegc information by sending the running Java program a SIGPROF signal.
Table 1-17 Actions, JVM Options Specified, and Allocation Site Statistics Data Locations (continued) Action JVM Options Specified Allocation Site Statistics Data Locations 'kill 21 ' -XX:+PrintAllocStatistics JVM creates a file for you, file name format is: java_.vgc 'kill 21 ' -XX:+PrintAllocStatistics Standard out -Xverbosegc 'kill 21 ' -XX:+PrintAllocStatistics Same location as Xverbosegc data file (mydata.vgc) -Xverbosegc:file=mydata.
Figure 1-19 HPjmeter GC Metric: Allocation Site Statistics Screen For more details about Allocation Site Statistics in HPjmeter, see the HPjmeter User's Guide at http://docs.hp.com/en/dev.html#Java. 1.
2 Useful System Tools for Java Troubleshooting This chapter contains information about HP-UX system tools that are useful when troubleshooting Java application problems. The tools discussed include: GlancePlus, tusc, Prospect, HP Caliper, sar, vmstat, iostat, swapinfo, top, netstat, and others. 2.1 GlancePlus GlancePlus is a system performance monitoring and diagnostic tool.
2.7 iostat The iostat command iteratively reports I/O statistics for each active disk on the system. For more information on this command, refer to the following webpage: http://docs.hp.com/en/B2355-60127/iostat.1.html 2.8 swapinfo The swapinfo command displays information about device and file system paging space. For more information on this command, refer to the following webpage: http://docs.hp.com/en/B2355-60127/swapinfo.1M.html 2.
3 Getting Help from Hewlett-Packard Sometimes you need help troubleshooting your Java application problems. Before opening a support call, search for information that might help you by referring to the Go Java! website: http://www.hp.com/go/Java This site contains much information about Java, including known issues, release notes, patches, downloads, documentation, and more.
a. b. c. What version of HP-UX is on the system? Provide the output from the uname -a command. What patches are installed on the system? This can be determined with HPjconfig or swlist. What window manager is being used? For example, Reflections X or X Windows. Or is the application running inside a browser? If so, which one? 4. Java Environment (refer to Section 3.4 for details) a. What is the version of the Java VM that is having the problem? Run the command java -version to retrieve this information.
3.2.1.1.
core.29757 $ ll core.29757 total 429296 -rw------1 test -rw-rw-rw1 test users users 219781020 Aug 29 12:33 core 2191 Aug 29 12:33 hs_err_pid29757.log 3.2.1.1.5 Ensure Permissions Allow Core Files Some Java processes run setuid; that is, a process where the effective uid or gid differs from the real uid or gid. On HP-UX 11i v1 (11.11) and later versions a kernel security feature prevents core file creation for these processes.
some other library names and version information ... 92453-07 dld dld dld.sl B.11.48 EXP 051121 3.2.2 Collecting Fatal Error Log Information When a Java application aborts, the fatal error log file (hs_err_pid.log) is generated. The contents of this file vary depending on the architecture and the Java version. (For example, early Java versions generate less information in the fatal error log.). Following is a summary of the type of information contained in this file: 1.
3.2.3 Collecting Stack Trace Information On PA-RISC systems, a stack trace is printed to stderr when the application aborts. On Integrity systems, branch and general register contents are printed to stderr when an application aborts. The stack trace (PA-RISC systems) and register contents (Integrity systems) are not printed to the hs_err_pid.log file; therefore, the contents of stderr should be captured into a file and sent to HP along with the hs_err_pid.log, core file, and libraries. 3.
application runtime environment variable values, run the following command under the same environment (that is, the same user) that the Java application was executed: (ksh) $ env > app_environment.txt (csh) $ getenv > app_environment.txt Include the app_environment.txt file when you send in your collected data files to HP. 3.4.2 Libraries In order to perform core file analysis, you must have access to libraries used by the failed application.
Table 3-1 Libjunwind Library Location for PA-RISC Systems Application Type libjunwind Location PA1.1 applications (java -pa11) /opt//jre/lib/PA_RISC/server/libjunwind.sl PA2.0 32–bit applications (default PA-RISC) /opt//jre/lib/PA_RISC2.0/server/libjunwind.sl PA2.0 64–bit applications (java -d64) /opt//jre/lib/PA_RISC2.0W/server/libjunwind.sl On Integrity systems, beginning with SDK 1.4.0.10 and JDK 1.5.0.
4 Core File Analysis The previous chapter described how to collect necessary information before opening a call to HP Support to get help troubleshooting Java applications. Sometimes it is possible to at least attempt the core file analysis on your own. This chapter walks through an example core file analysis step by step. By studying this example, you will learn some skills needed to analyze your own core file. HP-UX writes a file containing a core image of a process when certain signals are received.
# create header file /usr/bin/echo "Create header file" javah -verbose -jni StackTrace # compile jni code /usr/bin/echo "Compile c code" /usr/bin/cc +z -c -I $JAVA_HOME/include \ -I $JAVA_HOME/include/hp-ux stacktrace.c # create shared library /usr/bin/echo "Create shared library" /usr/bin/ld -b -o libstacktrace.sl stacktrace.o /usr/bin/echo "Run StackTrace program" export SHLIB_PATH=. export LD_LIBRARY_PATH=.
} System.out.println("Call dumpCore to convert " + ci + " to a binary string!"); System.out.println("The binary String: " + StackTrace.dumpCore(ci)); } // end methodMakeCall //************************************************** public static void main(String args[]) { int convertInt; System.out.println(); if(args.length == 1) { convertInt = Integer.parseInt(args[0]); } else { convertInt = 757; } System.out.println("Calling method1()"); StackTrace.method1(convertInt); System.out.
(*env)->ExceptionDescribe(env); (*env)->ExceptionClear(env); if(methodid == NULL) { return (*env)->NewStringUTF(env, "JNI GetStaticMethodID failed!"); } return (*env)->CallStaticObjectMethod(env, classid, methodid, intarg); } 4.2 Building the Application The StackTraceJob script can be used on PA-RISC systems to compile, build, and execute the application resulting in a core dump.
• • libstacktrace.sl—the runtime library stacktrace.o—the object file 4.3 Verifying the Core File Before you proceed further, verify that the core file, core, is complete and valid. You can do this in two steps. First, open the file in gdb and check the error and warning messages. $ gdb /opt/java1.4/bin/PA_RISC2.0/java core HP gdb 5.5.7 for PA-RISC 1.1 or 2.0 (narrow), HP-UX 11.00 and target hppa1.1-hp-hpux11.00. Copyright 1986 - 2001 Free Software Foundation, Inc. Hewlett-Packard Wildebeest 5.5.
Next, use gdb to pack the core file. $ gdb /opt/java1.4/bin/PA_RISC2.0/java core HP gdb 5.5.7 for PA-RISC 1.1 or 2.0 (narrow), HP-UX 11.00 and target hppa1.1-hp-hpux11.00. Copyright 1986 - 2001 Free Software Foundation, Inc. Hewlett-Packard Wildebeest 5.5.7 (based on GDB) is covered by the GNU General Public License. Type "show copying" to see the conditions to change it and/or distribute copies. Type "show warranty" for warranty/support. .. warning: core file may not match specified executable file.
Uncompress and extract the files from the packcore.tar.Z file: $ uncompress packcore.tar.Z $ tar -xvf packcore.tar packcore/ packcore/modules.tar packcore/progname.txt packcore/core Delete the packcore.tar file because you have extracted the files. Next, move the modules.tar and core files back to the current directory so all the files needed for debugging are together. Finally, unpack the modules.tar file. $ rm packcore.tar $ mv packcore/core . $ mv packcore/modules.tar . $ tar -xvf modules.tar java dld.
4.7 Example gdb Session Before beginning core file analysis, examine the fatal error log file, hs_err_pid.log. This file contains useful information that will help you troubleshoot the problem. For more information about the contents of the hs_err_pid.log file, refer to Section 3.2.2., Collecting Fatal Error Log Information . You are now ready to examine the core file. This document assumes the reader understands HP-UX procedure calling conventions.
Program terminated with signal 6, Aborted. #0 0xc0214db0 in kill+0x10 () from ./libc.2 The first step is to look at the stack trace of the failing thread. Do this by issuing gdb's backtrace command. The following example shows the backtrace output, which has been annotated with the comment “FAILED HERE” at the point of failure: (gdb) backtrace #0 0xc0214db0 in kill+0x10 () from ./libc.2 #1 0xc01ab554 in raise+0x24 () from ./libc.2 #2 0xc01f1a78 in abort_C+0x160 () from ./libc.
(gdb) print (0xc3ed2ec8-0xc3ed2da0)/4 + 1 $7 = 75 You want to display 75 instructions from the beginning of the get_method_id() function to the point of failure for frame 9. Because this is a substantial number of instructions, redirect the output to a file: (gdb) set redirect-file frame9instrs (gdb) set redirect on Redirecting output to frame9instrs. (gdb) x /75i 0xc3ed2da0 (gdb) set redirect off You would probably print out this file to examine it in detail.
0xc3ed2e28 0xc3ed2e2c 0xc3ed2e30 0xc3ed2e34 0xc3ed2e38 0xc3ed2e3c 0xc3ed2e40 0xc3ed2e44 0xc3ed2e48 0xc3ed2e4c 0xc3ed2e50 0xc3ed2e54 0xc3ed2e58 0xc3ed2e5c 0xc3ed2e60 0xc3ed2e64 0xc3ed2e68 0xc3ed2e6c 0xc3ed2e70 0xc3ed2e74 0xc3ed2e78 0xc3ed2e7c : : : : : : : : : : :
Redirecting output to frame10instrs. (gdb) x /61i 0xc3ed33e0 (gdb) set redirect off The following output is the annotated listing of the redirected output file, frame10instrs. Note that the parameters to the jni_GetStaticMethodID() function have been removed to simplify the listing.
Trace through the instructions to see where R25 was loaded with a value. The first place this happens is at offset 0xcc: 0xc3ed34ac : ldw -0xb0(%sp),%r25 In this instruction, R25 is loaded with the value at sp-0xb0. Use gdb to examine the memory at sp-0xb0, displaying the output as an address: (gdb) x /2x $sp-0xb0 0x59a00: 0x00000000 0x00000000 The value of R25 is 0, and it is carried through to frame 9 leading to the abort. R25 is loaded with sp-0xb0 in frame 10.
Glossary GC Garbage collection. gid Group id. HotSpot VM The JDK comes with a virtual machine implementation called the Java HotSpot VM. Java VM On HP implementations this is the same as the HotSpot VM. JDK The Java Developer's Kit is the set of Java development tools consisting of the API classes, a Java compiler, and the Java virtual machine.
Index intended audience, 9 locating, 9 organization, 9 publishing history, 9 related information, 11 typographic conventions, 10 Symbols -verbose:class, 42 -verbose:gc, 42 -verbose:jni, 42 -Xcheck:jni , 45 -Xverbosegc, 46 -XX:+HeapDump, 47 -XX:+HeapDumpOnCtrlBreak, 48 -XX:+HeapDumpOnly, 49 -XX:+HeapDumpOnOutOfMemoryError, 48 -XX:+ShowMessageBoxOnError, 50 -XX:ErrorFile, 49 -XX:OnError, 50 _JAVA_HEAPDUMP environment variable, 47 H deadlocked process tools and options for debugging, 13 Developer and Soluti
L libjunwind, 63 location on Integrity systems, 64 location on PA-RISC systems, 63 locating this guide, 9 M memory monitoring tools and options, 14 miscellaneous troubleshooting tools and options, 16 N netstat, 56 P packcore, 63 performance tools, 15 problem report checklist, 57 Prospect, 55 publishing history, 9 R related information, 11 S sar, 55 Serviceability Agent, 17 stack trace information, 62 swapinfo, 56 system information, 62 system tools, 55 T top, 56 tusc, 55 typographic conventions, 10 V