
Java Tools for HP-UX 11i: Quick Start & Migration Guide


6
o -f : read and evaluate script from standard input
o help, -? : display help message
o -q : list all available script engines
• Options that behave differently
o none
jsadebugd
The Java Servicability Debug Daemon acts as a debug server for a running JVM or a core file.
• This tool is not available on HP-UX 11i
jstack
The jstack tool produces stack traces for Java processes or core files.
• Options that behave the same on both platforms
o -l : long listing
o -h, -help : display help message
• Options that are not available on HP-UX 11i
o -F : force stack dump when jstack does not respond
o -m : prints mixed mode (Java and native) stack trace
• First available with 6.0.03 on HP-UX 11i
• On HP-UX 11i, you can use the gdb backtrace command to obtain a stack trace with both
Java and native frames. This is equivalent to the -m option of jstack.
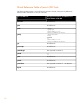
jstat
The jstat tool displays performance statistics for instrumented JVMs.
• Options that behave the same on both platforms
o -help : display help message
o -version :displayversion
o -options : display list of available options
§ -class : class loader statistics
§ -compiler : compiler statistics
§ -gc : garbage collector statistics
§ -gccapacity : generation capacities
§ -gccause : summary of gc statistics with cause of current event
§ -gcnew : statistics for new generation
§ -gcnewcapacity : capacity of new generation
§ -gcold : statistics for old generation
§ -gcoldcapacity : capacity of old generation
§ -gcpermcapacity : statistics for perm generation
§ -gcutil : summary of gc statistics
§ -printcompilation : method compilation statistics
o -t : display column with timestamp
o -h <n> : display column header every n lines
o -J<option> : pass option to the Java launcher
o <vmid> : Virtual Machine Identifier
o <interval> : sampling interval
o <count> : number of samples to take before exiting
• Options that behave differently