
HP Caliper 5.7 User Guide (769153-001, March 2014)
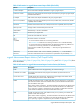
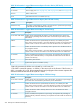
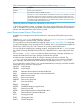
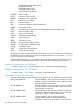

Table 29 Information in scgprof Measurement Report Fields (Flat Profile)
DescriptionColumn
Percent of the total IP samples attributable to a given program object.% Total IP Samples
Running sum of the percent of total IP samples accounted for by the given program object
and those listed above it.
Cumulat % of Total
Total number of IP samples attributed to the given program object.IP Samples
Number of seconds accounted for by this function/module alone, if this function/module
is profiled; otherwise blank.
Secs in Func/Module
Number of times this function was invoked, if this function is profiled; otherwise, blank.Call Count
Average number of milliseconds per function call.Msecs per Call
Shared library or the main executable.Load Module
Routine from your application.Function
Source file associated with a function.File
The column contains one of these:Line |
Slot |
Col,Offset
• A source-code line number for rows showing statements
• An instruction slot number for rows showing instructions not on a bundle boundary
• A source-code column number followed by an offset from the beginning address of a
function for rows showing instructions on a bundle boundary
Column and line numbers are preceded by “~” when they are approximate due to
optimization.
The column contains either a source statement, preceded by “>”, or a disassembled
instruction. Statements that are out of order due to optimization are preceded by “*>”.
>Statement |
Instruction
scgprof Measurement Report Metrics (Call Graph Profile)
Table 30 (page 225), Table 31 (page 226), Table 32 (page 226), and Table 33 (page 226) show
more information.
Table 30 Information in scgprof Measurement Report: Function Entries (Self Entries)
DescriptionColumn
Index of the function in the call graph listing, as an aid to locating it.Index
Percentage of the total hits of the program accounted for by this function and its
descendants.
% Total Hits In or Under
Number of hits due to this function, expressed as a percentage of the number of hits
accounted for by this function and its descendants.
% Func Hits In Func
Number of times this function is called, other than recursive calls. If this is a cycle entry,
this means the number of times the members of this cycle are called from functions that
are not members of this cycle.
Called
If this column contains a hyphen (-), this means that there is at least one call, but the exact
number of calls is unknown. This notation can mean that the function was called inline.
For a cycle entry, a hyphen is reported if any of its members is called inline and if the
inline member is called from one of the outside callers of the cycle.
Number of times this function calls itself recursively. For a cycle entry, this denotes the
number of calls within the cycle.
+Self
If this column contains a hyphen (-), this means that there is at least one call, but the exact
number of calls is unknown. This notation can mean that the function was called inline.
For a cycle entry, a hyphen is reported if any of its members is called inline.
scgprof Measurement Report Description 225