
HP-UX Host Intrusion Detection System Version 4.3 administrator guide
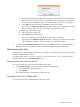
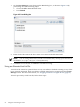
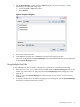

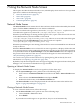
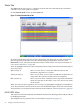
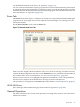
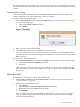
Table Of Contents
- HP-UX Host Intrusion Detection System Version 4.3 administrator guide
- Table of Contents
- About This Document
- 1 Introduction
- 2 Configuring HP-UX HIDS
- 3 Getting Started with HP-UX HIDS
- 4 Using the System Manager Screen
- Starting the HP-UX HIDS System Manager
- Stopping the HP-UX HIDS System Manager
- System Manager Components
- Starting HP-UX HIDS Agents
- Getting the Status of Agent Hosts
- Resynchronizing Agent Hosts
- Activating Schedules on Agent Hosts
- Stopping Schedules on Agent Hosts
- Halting HP-UX HIDS Agents
- Accessing Other Screens
- 5 Using the Schedule Manager Screen
- The Schedule Manager
- Configuring Surveillance Schedules
- Configuring Surveillance Groups
- Configuring Detection Templates
- Setting Surveillance Schedule Timetables
- Configuring Alert Aggregation
- Configuring Monitor Failed Attempts
- Configuring Duplicate Alert Suppression
- Viewing Surveillance Schedule Details
- Predefined Surveillance Schedules and Groups
- 6 Using the Host Manager Screen
- 7 Using the Network Node Screen
- 8 Using the Preferences Screen
- A Templates and Alerts
- Alert Summary
- UNIX Regular Expressions
- Limitations
- Template Property Types
- Buffer Overflow Template
- Race Condition Template
- Modification of files/directories Template
- Changes to Log File Template
- Creation and Modification of setuid/setgid File Template
- Creation of World-Writable File Template
- Modification of Another User’s File Template
- Login/Logout Template
- Repeated Failed Logins Template
- Repeated Failed su Commands Template
- Log File Monitoring Template
- B Automated Response for Alerts
- C Tuning Schedules and Generating Alert Reports
- D The Agent Configuration File
- E The Surveillance Schedule Text File
- F Error Messages
- G Troubleshooting
- Troubleshooting
- Agent and System Manager cannot communicate with each other
- Agent complains that idds has not been enabled, yet lsdev shows /dev/idds is present
- Agent does not start on system boot
- Agent halts abnormally, leaving ids_* files and message queues
- Agent host appears to hang and/or you see message disk full
- Agent needs further troubleshooting
- Agent does not start after installation
- Agents appear to be stuck in polling status
- Agent displays error if hostname to IP mapping is not registered in name service
- Aggregated alerts targets or details field are truncated and the same aggregated alert has several entries logged in the IDS_ALERTFILE
- Alert date/time sort seems inconsistent
- Alerts are not being displayed in the alert browser
- Buffer overflow triggers false positives
- Duplicate alerts appear in System Manager
- Getting several aggregated alerts for the same process
- GUI runs out of memory after receiving around 19,000 alerts
- The idsadmin Command needs installed agent certificates
- The idsadmin Command notifies of bad certificate when pinging a remote agent
- IDS_checkInstall fails with a kmtune error
- IDS_genAdminKeys or IDS_genAgentCerts does not complete successfully
- IDS_genAdminKeys or idsgui quits early
- Large files in /var/opt/ids
- Log files are filling up
- No Agent Available
- Normal operation of an application generates heavy volume of alerts
- Reflection X rlogin produces multiple login and logout alerts
- Schedule Manager timetable screen appears to hang
- SSH does not perform a clean exit after idsagent is started
- System Manager appears to hang
- System Manager does not let you save files to specific directories
- System Manager does not start after idsgui is started
- System Manager starts with no borders or title bar in X client programs on Windows
- System Manager times out on agent functions such as Activate and Status Poll
- UNKNOWN program and arguments in certain alert messages
- Using HP-UX HIDS with IPFilter and SecureShell
- Unable to Generate Administrator Keys and Agent Certificates on PA–RISC 1.1 Systems
- Troubleshooting
- H HP Software License

7 Using the Network Node Screen
This chapter describes the Network Node screen, which displays alerts and errors for a specified
agent host. It addresses the following topics:
• “Network Node Screen” (page 95)
• “Alerts Tab” (page 96)
• “Errors Tab ” (page 97)
• “General Operations” (page 97)
Network Node Screen
The Network Node screen contains lists of alerts and errors that have been detected by the related
agent. Click the Alerts or Errors tab to view the lists and details.
Alerts are recorded on the agent host system in the /var/opt/ids/alert.log file. Errors are
recorded on the agent host system in the /var/opt/ids/error.log file.
When the System Manager is running and the agent is active, copies of the alert records are sent
to the administration system and added to a file named
/var/opt/ids/gui/logs/hostname_alert.log, where hostname is the name of the agent
host as displayed on the Host Manager screen. Error records are copied to
/var/opt/ids/gui/logs/hostname_error.log.
When the System Manager is not running, alerts and errors are not transmitted but are still stored
locally in the host.
When the Network Node screen is selected for an active agent host, it displays all the alert and
error messages that are in the standard System Manager log files for the agent. If the agent host
is resynchronized from the System Manager screen, the Network Node screen also displays all
the previous alerts and errors that were received from the agent. For more information, see
“Resynchronizing Agent Hosts” (page 52).
You can also view previous alerts and errors by opening the log file set directly. For more
information, see “Opening a Log File Set” (page 102).
By default, only the most important error messages are logged by the agent and sent to the System
Manager. You can create more detailed error logs if needed.
Opening a Network Node Screen
To display the Network Node screen for an agent host, follow these steps:
• On the System Manager screen, perform one of the following steps:
• Select a host in the Monitored Nodes list and choose the View > Network Node menu
item.
• Select a host in the Monitored Nodes list and press Ctrl+B.
• Double-left-click an entry in the Monitored Nodes list.
The Network Node screen is displayed with the selected host name in the title bar. See
Figure 7-1 (page 96) and Figure 7-2 (page 97).
Closing a Network Node Screen
To close a Network Node screen, follow these steps:
• On the Network Node screen, perform one of the following steps:
• Choose the File > Close menu item.
• Press Ctrl+C.
If you made unsaved changes to an open file set, they are saved automatically.
Network Node Screen 95