
HP-UX Host Intrusion Detection System Version 4.3 administrator guide
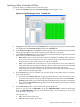
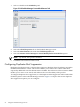
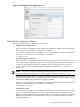
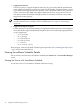
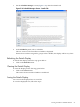
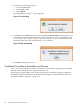
Table Of Contents
- HP-UX Host Intrusion Detection System Version 4.3 administrator guide
- Table of Contents
- About This Document
- 1 Introduction
- 2 Configuring HP-UX HIDS
- 3 Getting Started with HP-UX HIDS
- 4 Using the System Manager Screen
- Starting the HP-UX HIDS System Manager
- Stopping the HP-UX HIDS System Manager
- System Manager Components
- Starting HP-UX HIDS Agents
- Getting the Status of Agent Hosts
- Resynchronizing Agent Hosts
- Activating Schedules on Agent Hosts
- Stopping Schedules on Agent Hosts
- Halting HP-UX HIDS Agents
- Accessing Other Screens
- 5 Using the Schedule Manager Screen
- The Schedule Manager
- Configuring Surveillance Schedules
- Configuring Surveillance Groups
- Configuring Detection Templates
- Setting Surveillance Schedule Timetables
- Configuring Alert Aggregation
- Configuring Monitor Failed Attempts
- Configuring Duplicate Alert Suppression
- Viewing Surveillance Schedule Details
- Predefined Surveillance Schedules and Groups
- 6 Using the Host Manager Screen
- 7 Using the Network Node Screen
- 8 Using the Preferences Screen
- A Templates and Alerts
- Alert Summary
- UNIX Regular Expressions
- Limitations
- Template Property Types
- Buffer Overflow Template
- Race Condition Template
- Modification of files/directories Template
- Changes to Log File Template
- Creation and Modification of setuid/setgid File Template
- Creation of World-Writable File Template
- Modification of Another User’s File Template
- Login/Logout Template
- Repeated Failed Logins Template
- Repeated Failed su Commands Template
- Log File Monitoring Template
- B Automated Response for Alerts
- C Tuning Schedules and Generating Alert Reports
- D The Agent Configuration File
- E The Surveillance Schedule Text File
- F Error Messages
- G Troubleshooting
- Troubleshooting
- Agent and System Manager cannot communicate with each other
- Agent complains that idds has not been enabled, yet lsdev shows /dev/idds is present
- Agent does not start on system boot
- Agent halts abnormally, leaving ids_* files and message queues
- Agent host appears to hang and/or you see message disk full
- Agent needs further troubleshooting
- Agent does not start after installation
- Agents appear to be stuck in polling status
- Agent displays error if hostname to IP mapping is not registered in name service
- Aggregated alerts targets or details field are truncated and the same aggregated alert has several entries logged in the IDS_ALERTFILE
- Alert date/time sort seems inconsistent
- Alerts are not being displayed in the alert browser
- Buffer overflow triggers false positives
- Duplicate alerts appear in System Manager
- Getting several aggregated alerts for the same process
- GUI runs out of memory after receiving around 19,000 alerts
- The idsadmin Command needs installed agent certificates
- The idsadmin Command notifies of bad certificate when pinging a remote agent
- IDS_checkInstall fails with a kmtune error
- IDS_genAdminKeys or IDS_genAgentCerts does not complete successfully
- IDS_genAdminKeys or idsgui quits early
- Large files in /var/opt/ids
- Log files are filling up
- No Agent Available
- Normal operation of an application generates heavy volume of alerts
- Reflection X rlogin produces multiple login and logout alerts
- Schedule Manager timetable screen appears to hang
- SSH does not perform a clean exit after idsagent is started
- System Manager appears to hang
- System Manager does not let you save files to specific directories
- System Manager does not start after idsgui is started
- System Manager starts with no borders or title bar in X client programs on Windows
- System Manager times out on agent functions such as Activate and Status Poll
- UNKNOWN program and arguments in certain alert messages
- Using HP-UX HIDS with IPFilter and SecureShell
- Unable to Generate Administrator Keys and Agent Certificates on PA–RISC 1.1 Systems
- Troubleshooting
- H HP Software License

For example, you may select Monday, Tuesday, Friday, and Sunday.
7. In the Select Times panel, choose the hour blocks in which the group should run.
This is a list, so you can use left-click to pick a hour, Shift-left-click to add in all intervening
hours, and Ctrl-left-click to add or remove individual hours. For more detail, see “Selecting
with the Mouse” (page 98).
You can also use:
• All to select all 24 hours
• None to deselect all 24 hours
For example, you could select 01:00 - 04:59, 07:00 - 07:59, and 09:00 - 16:59.
8. As days and times are selected, the day-time matrix in the Schedule Summary panel is filled
in with the names of the active groups in each box. The matrix shows the sum of all the
timetables for all the groups in the selected surveillance schedule. Boxes with at least one
active group are colored green. The Schedule Summary panel is read-only.
NOTE: A schedule group cannot run on different hours on different days. To do this, copy the
group and schedule the identical groups to separate times and days.
Canceling Changes
The Cancel button allow you to delete all the changes you have made to group timetables. The
button is greyed out when there is nothing to cancel.
NOTE: If you switch to the Configure tab, the changes are set and the button is greyed out
when you return to the Timetable tab.
Saving a Surveillance Schedule
See “Saving a Surveillance Schedule” (page 63).
Configuring Alert Aggregation
Alert aggregation can reduce the overall number of alerts for better manageability, while
maintaining a detailed description of each potential intrusive activity.
Alert aggregation is a surveillance schedule feature that, when enabled, aggregates file related
alerts triggered by the same process or by multiple related processes. When a surveillance schedule
has alert aggregation enabled, thousands of file related real-time alerts triggered by a process or
group of related processes can be aggregated into a single aggregated alert. Alert aggregation
facilitates the administrator’s task of analyzing alerts by reducing the total number of alerts
issued. For example, without alert aggregation, a rm /etc/* command generates multiple
real-time alerts for deleting files that are specified as read-only by the Modification of
files/directories detection template. With alert aggregation enabled, a single aggregated alert is
issued to capture the deletion of all the files by the same process executing the rm command.
Alert aggregation can be configured to aggregate alerts triggered by a process running a specified
program and by the process descendent processes (that is, child process, grandchild process,
and so on) . For example, installing a bundle using the swinstall command can trigger many
alerts by a process running swagent in addition to the alerts triggered by swagent’s descendent
processes. The swagent descendent processes run commands in the control scripts associated
with the bundle. This feature, therefore, allows all alerts triggered by a single action (installing
software) to be issued in a single aggregated alert instead of being issued as potentially hundreds
or thousands of real-time alerts triggered by multiple processes. When alert aggregation is
72 Using the Schedule Manager Screen