
HP-UX Encrypted Volume and File System Performance and Tuning


12
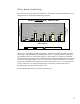
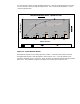
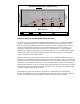
Figure 8 – Default Random Writes
Random writes exhibit a normal distribution where EVFS throughput is less than clear I/O due to the
EVFS Pseudo Driver path that I/O must traverse. However, the CPU Utilization differential between
clear I/O and EVFS is minimal, so that it would likely go unnoticed. Throughput is about 50% of
clear I/O, however.
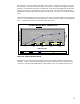
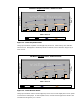
Figure 9 – Default Sequential Reads
Here is the first graph showing read results. These are sequential reads with default VxFS tuning.
Note that the scale of the X axis is Scale1, or 1/20
th
of the write graphs. Application reads from disk
can appear to be significantly slower than writes because of the buffer cache effect from write-behind.
64k Block Random Write - 100mb File Size
2%
7%
12%
18%
22%
4%
14%
17%
20%
20%
1 10 25 50 100
IOZone Threads
CPU Utilization %
Throughput KBs -
Scale20
Clear CPU EVFS CPU Clear Random Write EVFS Random Write
64k Block Sequential Read - 100mb File Size
5%
11%
15%
18%
18%
10%
29%
27%
30% 30%
1 10 25 50 100
IOZone Threads
CPU Utilization %
Throughput KBs -
Scale1
Clear CPU EVFS CPU Clear read EVFS read