
HP WDB GUI 5.8 Reference Manual ( February 2008 )

Debugging with WDB GUI
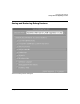
Debugging Memory Problems
Chapter 376
Viewing Memory Leaks and Heap Usage
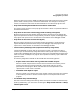
To view the leak report and heap report using HP WDB GUI, complete the following steps:
1. Load the application to the debugger by selecting File->Load Program.
In the Load Program dialog-box, enter the executable name to load the executable or use
the PID to attach the process for debugging.
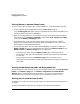
2. After you load the application, you can set the memory checking preferences by setting
the preferences in the Memory Checking window. Select Tools ->Memory Checking
to activate the Memory Checking window.
3. Set breakpoints by clicking the rectangular selection strip adjacent to the specific
program line-number in the source window. When the breakpoint is set, a red circular
button appears at the specified probe-point.
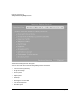
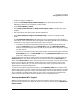
4. To view the heap report and leak reports while debugging the application, select the
Memory Usage tab in the command window. On selecting the Memory Usage tab, the
Memory Leaks and Memory Usage options are displayed.
• To view the leak report, select the Memory Leaks option. The stack-unwind
information for each leak can be obtained by expanding the enhanced array browser
for each leak.
• To see a heap report, select the Memory Usage option. The stack-unwind
information can be obtained by expanding the enhanced array browser for each block
of the heap.
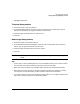
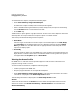
Viewing the Runtime Heap and Leak data graphically
To view the graphical representation of the runtime heap and leaks data, Click Show Graph
button in the Memory Usage Tab. The Memory Usage Viewer (Function Based)
window appears. It depicts the leak and heap data in a Pie Chart. The Pie charts are
redrawn based on the selected sorting options which include Bytes, Blocks or Callee.
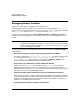
Viewing the Incremental Heap Profile
HP WDB GUI 5.7 and later versions provide support to view the incremental heap profile for
a program.
To view the incremental heap profile for a program, complete the following steps: