
HP WDB GUI 5.8 Reference Manual ( February 2008 )

Debugging with WDB GUI
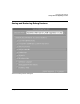
Debugging Memory Problems
Chapter 3 75
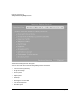
When this setting is turned on, WDB scrambles the space and overwrites it with a specific
pattern when a memory block is allocated or deallocated. This change to the memory
content, increases the chance that erroneous behaviors will cause the program to fail.
• Stop if the following block address is allocated or deallocated
This option can be turned on to stop a program whenever a block at a specified address is
allocated or deallocated.
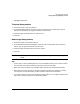
• Stop when an allocation causes heap growth exceeding num (bytes)
Monitors the amount of heap growth caused by memory allocations. If the heap grows
beyond the specified limit due to a single memory allocation request, the debugger stops
the program and reports this in the status bar at the bottom of the debugger window.
• Stop when an allocation exceeds num (bytes)
Monitors memory allocations. If the number of bytes allocated by a single allocation
request exceeds the specified number of bytes, the debugger stops the program and
reports this in the status bar at the bottom of the debugger window.
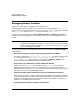
• Collect memory leak/usage data (reported in Memory Usage View)
Causes the debugger to collect data on the program's memory use. When the data is
collected, you can view the heap usage data and the memory leak report in the Memory
Usage View. The debugger discards the memory data it has collected when the application
exits. You can set a breakpoint at program exit to update the memory reports before the
application exits.
The memory usage data collected can be filtered with the following options:
— Report stack trace if block size is greater than number of bytes
Sets the number of bytes field to one less than the minimum size memory leak or
memory allocation that must be reported. Larger values improve run-time
performance of the program. Block sizes less than the value specified are still
reported, but no stack trace is available.
— Maximum stack depth to report
Sets the number in this field to control the number of stack frames that are recorded
at each memory allocation. Smaller values improve run-time performance of the
program.
• Incremental Heap Check Settings
Sets the incremental heap profile settings. Select this option to enable incremental heap
profiling. Additionally, you must enter the settings for Heap Check Interval and Heap
Check Repeat Count