
HP WDB GUI 5.8 Reference Manual ( February 2008 )

Debugging with WDB GUI
Fixing the Code from within the Debugger
Chapter 3 65
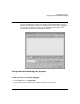
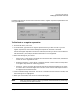
2. Click Browse... to display the Name of File to Fix dialog box.
3. In the dialog box, choose a file to add to the fix list.
4. Click OK to close the dialog box. The file you selected appears in the Add/Delete Fix List
Files dialog.
5. When you are finished adding files to the fix list, Click OK.All files in the list will be
monitored for changes.
To request an immediate rebuild of a specific file
1. On the Edit menu, click Fix List.... The Add/Delete Fix List Files dialog box appears.
2. In the Fix List dialog, highlight any of the files in the fix list that you want rebuilt and
patched in immediately.
3. Click OK in the Fix List dialog. The files you highlighted will be rebuilt and patched in
immediately.
Examining build errors and warnings
Build errors and warnings are posted to the Build View. The debugger displays the Build View
automatically when the debugger rebuilds code you have fixed.
To view the source code for an error or warning, double click on the error or warning in the
Build View. The source associated with the error or warning will be displayed in the Source
View.
Restrictions on fixing code from within the debugger
These types of source code changes cannot be fixed within the debugger:
• Adding, deleting or reordering the local variables and parameters in a function currently
active on the stack.
• Changing the data type of a local variable, file static, global variable, parameter of a
function.
• Changing a local, file static, or global variable to be a register variable, or vice-versa.
• Adding any function calls that increase the size of the parameter area.
• Adding an alloca() function to a frame that did not previously use alloca().
• Adding fields to a structure anywhere other than at the end of the structure.
• Changing the order of fields in a structure.