
HP WDB GUI 5.8 Reference Manual ( February 2008 )

Debugging with WDB GUI
Advancing Through Your Program
Chapter 3 37
• You can automatically set breakpoints every time the WDB GUI starts by specifying them
in the .gdbinit file. To automatically load breakpoints, add the following line to the
.gdbinit file:
break function_call
• You can save the breakpoints you have set by saving the debug session. You can later
restore the breakpoints you have saved by restoring the debug session.
Advancing Through Your Program
You can use the commands in this section to advance through your program during the
debugging process.
You can use the Step commands to help you locate the section of your program that is causing
a problem. For example, you can set a breakpoint at the beginning of a section, step through
the code, and examine variables until you isolate the problem.
You can use the other commands in this section to change or show the location of the program
counter.
Stepping into functions
The Step Into command provides a single step execution of the current instruction. If the
instruction is a function call, Step Into enters the function and single-steps through it.
You can use Step Into to traverse a program in detail by stepping into each instruction as it is
called.
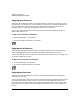
To step into a function or instruction
1. On the Debug menu, click Step Into.
2. Or, click the Step Into button in the toolbar: