
HP WDB GUI 5.8 Reference Manual ( February 2008 )


Debugging with WDB GUI
Starting and Stopping the Debug Process
Chapter 330
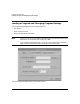
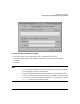
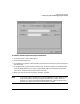
Tips: To save the program settings that you set in the Load Program dialog box, click Save
Session on the File menu and make sure that the Program Settings (Load Program) check box
is checked.
Starting and Stopping the Debug Process
You can use the commands in this section to control the execution of the program in the
debugger. The Go and Restart options provide two ways to start the debugging process. For
example, you may need to restart the debugging process as you use breakpoints to isolate
problems in the program.
Stop Debugging offers a way to stop execution and enable loading of a new executable. If the
debugger is attached to an existing process, Stop Debugging detaches the process. The Break
Execution option allows you to interrupt the program while it is executing, which is helpful
when you have not set breakpoints or cannot run to the cursor interactively. For example, you
can use Break Execution to stop execution in an infinite loop.
Starting the debug process (Go)
The Go option starts program execution or continues execution from the location of the
program counter.
To start debugging
1. On the Debug menu, click Go.
2. Or, click the Go button in the toolbar:
Restarting the debug process (Restart)
The Restart command resets execution to the beginning of the program being debugged. It
uses the current program arguments and environment variables settings. The debugger
pauses at the program’s entry point, and clears and initializes the Watch, Local Variables, and
Call Stack views.
If the debugger is attached to an existing process, Restart detaches the process and starts a
new process.