
HP WDB GUI 5.7 Release Notes (September 2007)

HP WDB GUI provides support to view the incremental heap profile for a program.
To view the incremental heap profile for a program, complete the following steps:
1. Load the program to the debugger
2. Select Tools->Memory Check
3. Select the Incremental Heap Check Settings option while setting the memory debugging
preferences in the Memory Check window
4. Enter the Heap Check Interval and the Heap Check Repeat Count in the Memory Check
window
5. Run the program after setting the required breakpoints
6. Select View->Memory Usage->Incremental Heap to view the incremental heap profile
The Incremental Heap View window displays the incremental heap profile graph for the program.
The incremental heap profile graph can be plotted based on the outstanding allocations in the
program or the actual heap profile, as follows:
To view the incremental heap profile graph based on the outstanding allocations, select the
Allocation option in the Plot Graph frame. The Allocation Profile displays the outstanding
allocations (in KB) in the program with unique color coding for each interval.
To view the incremental heap profile graph based on the actual heap profile, select the Actual
Heap option in the Plot Graph frame. The Heap Space Profile displays the heap size in KB
for the program.
To specify the time interval for displaying the incremental heap profile, you must select the Select
Timeoption and specify the start time and the end time from the Start Time list menu and the End
Time list menu. The listings for time in the Start Time list menu and the End Time list menu are
derived by dividing the total program execution time into five equal intervals. Additionally, you can
enter a custom start time, or a custom end time for displaying the incremental heap profile.
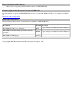
To view the incremental heap profile summary, click Summary Table. The summary table displays
the record ID, the start time,the end time, the heap interval, the heap start, the heap end, the heap
size in bytes, the number of allocated bytes, and the number of blocks used for all the collected
incremental heap profile records. Click on the required incremental heap profile record to view the
block allocation details for the corresponding record.
Support for Viewing Execution Path Entries
Inputs pending
Support for the Mouse Scroll Wheel
The support for the mouse scroll view is now available is all source views and disassembly views.
Patches, Defects, and Fixes
WDB GUI does not display the general register.
WDB GUI changes the permissions for the history file