
Debugging with GDB (September 2007)
78 Debugging with GDB
coprocessor are always saved in “extended” (raw) format, but all C programs expect to work
with “double” (virtual) format. In such cases, GDB normally works with the virtual format
only (the format that makes sense for your program), but the info registers command
prints the data in b oth formats.
Normally, register values are relative to the selected stack frame (see Section 6.5 [Select-
ing a frame], page 53). This means that you get the value that the register would contain
if all stack frames farther in were exited and their saved registers restored. In order to see
the true contents of hardware registers, you must select the innermost frame (with ‘frame
0’).
However, GDB must deduce where registers are saved, from the machine code generated
by your compiler. If some registers are not saved, or if GDB is unable to locate the saved
registers, the selected stack frame makes no difference.
8.11 Printing Floating Point Values
You can print the values of floating-point registers in different formats.
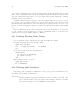
To print both single and double-precision values:
(gdb) info reg $fr5
fr5 (single precision) 10.1444092
fr5 (double precision) 600000
To get the bit pattern, try the following macro:
define pbits
set *((float *) $sp)=$arg0
p/x *((int *) $sp)
end
This is what the macro produces:
(gdb) pbits $fr6
$1 = 0x4082852d
8.12 Floating point hardware
Depending on the configuration, GDB may be able to give you more information about
the status of the floating point hardware.
info float
Display hardware-dependent information about the floating point unit. The
exact contents and layout vary depending on the floating point chip. Currently,
‘info float’ is supported on the ARM and x86 machines.