
Debugging with GDB (September 2007)
Chapter 4: Running Programs Under GDB 29
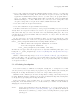
(gdb) info threads
(gdb) thread 1
Thread ID 1 not known. Use the "info threads" command to
see the IDs of currently known threads.
Following commands are used to debug multi-threaded programs:
• ‘thread threadno ’, a command to switch among threads
• ‘info threads’, a command to inquire about existing threads
• ‘thread apply [threadno ] [all ] args’, a command to apply a command to a list of
threads
The GDB thread debugging facility allows you to observe all threads while your program
runs—but whenever GDB takes control, one thread in particular is always the focus of
debugging. This thread is called the current thread. Debugging commands show program
information from the perspective of the current thread.
Whenever GDB detects a new thread in your program, it displays the target system’s
identification for the thread with a message in the form ‘[New systag]’. systag is a thread
identifier whose form varies depending on the particular system. For example, on LynxOS,
you might see
[New process 35 thread 27]
when GDB notices a new thread. In contrast, on an SGI system, the systag is simply
something like ‘process 368’, with no further qualifier.
For debugging purposes, GDB associates its own thread number—always a single
integer—with each thread in your program.
info threads
Display a summary of all threads currently in your program. GDB displays for
each thread (in this order):
1. the thread number assigned by GDB
2. the target system’s thread identifier (sys tag)
3. the current stack frame summary for that thread
An asterisk ‘*’ to the left of the GDB thread number indicates the current
thread.
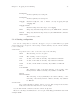
For example,
(gdb) info threads
3 process 35 thread 27 0x34e5 in sigpause ()
2 process 35 thread 23 0x34e5 in sigpause ()
* 1 process 35 thread 13 main (argc=1, argv=0x7ffffff8)
at threadtest.c:68
On HP-UX systems:
For debugging purposes, GDB associates its own thread number—a small integer as-
signed in thread-creation order—with each thread in your program.
Whenever GDB detects a new thread in your program, it displays both GDB’s thread
numb e r and the target system’s identification for the thread with a message in the form
‘[New systag]’. systag is a thread identifier whose form varies depending on the particular
system. For example, on HP-UX, you see