
Debugging with GDB (September 2007)
210 Debugging with GDB
• Section 16.2.5 [Global Breakpoint C ommands], page 221.
• Section 16.2.6 [Assertion Control Com mands], page 221.
• Section 16.2.7 [Record and Playback Commands], page 221.
• Section 16.2.8 [Macro Facility C ommands], page 222.
• Section 16.2.9 [Signal Control Commands], page 222.
• Section 16.2.10 [Miscellaneous Commands], page 223.
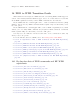
16.1.1 Invocation commands
By default, HP WDB runs in line mode. To run it with a terminal user interface similar
to that of XDB, use the -tui option.
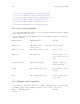
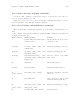
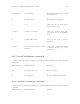
The following table lists the XDB and the equivalent WDB commands for invoking the
terminal user interface:
XDB Command WDB Equivalent Meaning
xdb program gdb -xdb program, gdb -xdb
-tui program
Debug program
xdb program corefile gdb -xdb program -c corefile Debug core file
xdb -d dir gdb -xdb -d dir Specify alternate direc-
tory to search for source
files
xdb -P pid program gdb -xdb program pid Attach to running pro-
gram at invo cation
xdb -i (after starting) run < file Specify input to target
program
xdb -o (after starting) run > file Specify output from tar-
get program
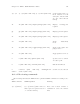
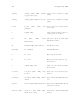
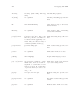
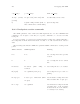
16.1.2 Window mode commands
The following commands are TUI mode or XDB compatibility mode commands. They
are available when you invoke WDB by using the -tui or -xdb or both options.
XDB
Command
WDB Equivalent Meaning