
Debugging with GDB (September 2007)


204 Debugging with GDB
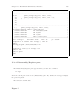
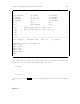
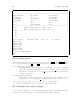
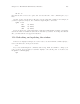
|-------------------------------------------------------------------------|
|flags 29000041 r1 51a800 rp 7f6ce597 |
|r3 7f7f0000 r4 1 r5 7f7f06f4 |
|r6 7f7f06fc r7 7f7f0800 r8 7f7f0800 |
|r9 40006b10 r10 0 r11 40004b78 |
|r12 1 r13 0 r14 0 |
|r15 0 r16 40003fb8 r17 4 |
|-------------------------------------------------------------------------|
*>:32 print_average (my_list, first, last); :
:33 print_average (my_list, first, last - 3); :
:34 } :
:35 :
:36 :
:37 :
:......................................................................:
File: average.c Procedure: main Line: 32 pc: 0x3524
(gdb) la asm
(gdb) la split
(gdb) la regs
(gdb) la src
(gdb) la regs
(gdb) foc next
Focus set to REGS window.
(gdb)
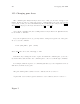
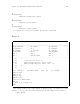
15.6 Scrolling panes
To scroll within a pane, you can use the arrow keys or the
h
Page Up
i
and
h
Page Down
i
keys
(on some keyboards these are
h
Prev
i
and
h
Next
i
). You can also use the following commands:
{+ | -} [num_lines] [win_name ]
Vertically scroll the pane forward (+) or backward (-). + or - with no arguments
scrolls the pane forward or backward one page. Use num lines to specify how
many lines to scroll the pane. Use win name to s pe cify a pane other than the
one with logical focus.
{< | >}[num_char] [win_name ]
Horizontally scroll the pane left (<) or right (>) the specified number of char-
acters. If you do not specify num char, the pane is scrolled one character.
Note that a space is required between the +, -, <, or > and the number.
To scroll the command pane, use the scroll bars on the terminal pane.
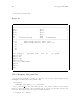
15.7 Changing the register display
To look at the floating-point or special registers instead of the general registers, and then
to return to the general registers, you can use the following XDB commands: