
Debugging with GDB (September 2007)

196 Debugging with GDB
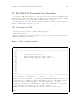
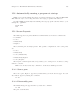
The terminal window is divided into two panes: a Source pane at the top and a Command
pane at the bottom. In the middle is a locator bar that shows the c urrent file, procedure,
line, and program counter (PC) address, when they are known to the debugger.
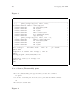
When you set a breakpoint on the main program by issuing the command
b main
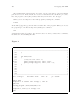
an asterisk (*) appears opposite the first executable line of the program. When you execute
the program up to the first breakpoint by iss uing the command
run
a right angle bracket (>) points to the current location. So after you issue those commands,
the window looks something like this:
Figure 2
|----------------------------------------------------------------------|
|27 } |
|28 |
|29 int main(void) |
|30 { |
|31 /* Try two test cases. */ |
*>|32 print_average (my_list, first, last); |
|33 print_average (my_list, first, last - 3); |
|34 } |
|35 |
|36 |
|37 |
|38 |
|39 |
|----------------------------------------------------------------------|
File: average.c Procedure: main Line: 32 pc: 0x3524
..
(gdb) b main
Breakpoint 1 at 0x3524: file average.c, line 32.
(gdb) run
Starting program: /home/work/wdb/a.out
Breakpoint 1, main () at average.c:32
(gdb)