
Debugging with GDB (September 2007)
Chapter 14: HP-UX Configuration-Specific Information 167
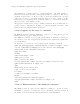
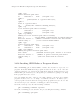
(gdb) i gep
Global execution path table:
G0 0x4000a80:2 main (execpath.c:10)
(gdb) n
16 printf("Value of c greater than 0\n");
(gdb) n
Value of c greater than 0
18 printf("All condition checking done\n");
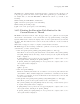
(gdb) i ep
Local execution path table for main():
0 0x4000a80:2 (execpath.c:10)
2 0x4000bd0:2 (execpath.c:16)
(gdb) i ep summary
Summary for local execution path table for main()
Size: 3 \*Total Number of Branch Paths in Current Function
Effective entries: 2 \*Number of Branches executed till this instant
Current entry: 2 \* Last executed branch number
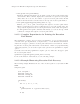
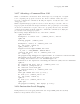
(gdb) i gep
Global execution path table:
G0 0x4000a80:2 main (execpath.c:10)
G1 0x4000bd0:2 main (execpath.c:16)
(gdb) i gep summary
Summary for global execution path table
Size: 65536 \*Maximum execution path entries to be stored
Effective entries: 2 \*Number of global execution path entries
Current entry: 1 \*The last Global Path ID executed
(gdb)
14.16 Invoking GDB Before a Program Aborts
This -crashdebug option enables GDB to monitor the execution of a process or a
program. It invokes GDB when the program execution is about to abort. Once the
debugger is invoked, you can debug the application using the normal debugger com-
mands. This option enables you to debug a live process instead of getting a core dump
if the program is about to abort.
You can examine the state of the process, m ake changes to the state and continue
program execution, force a core dump, or terminate execution. It enables you to
control program execution under the debugger if the program is about to abort. You
can load a new process or attach to a running proc ess for monitoring.
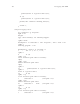
To monitor a new process, enter the following command:
gdb -crashdebug <command> <options>
To monitor a running pro c es s, attach to the process using the following command:
gdb -crashdebug -pid <pid>