
Debugging with GDB (September 2007)
164 Debugging with GDB
The dumpcore command with no arguments saves the core image for the current process
being debugged in the file named core.<pid>, where pid is the process ID numb er.
To analyze this core file with HP WDB on HP-UX 11i version 2, you must do the
following:
When starting from HP WDB command line:
(gdb) core-file [core.pid | core-filename]
When starting from shell prompt:
$ gdb -core a.out [core.pid | core-filename]
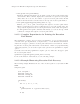
14.15 Printing the Execution Path Entries for the
Current Frame or Thr ead
HP WDB 5.7 and later versions of the debugger enable you to print the execution path
entries in the c urrent frame, or the current thread for programs running on Integrity
systems. This feature enables the display of the execution path taken across branched
modules. The first instruction in each block associated with the exe cuted branch is
displayed.
This feature is supported only for compiler versions A.06.15 and later.
HP WDB supports the following c omm ands to print the execution path entries in the
current frame, or in the current thread:
• info exec-path [start_index] [end_index] (aliased to info ep)
Lists all the local execution path entries in the current frame. The [start_index]
and [end_index] indicate the range of table indexes (execution path entries) that
must be displayed.
If [end_index] is not specified, the debugger displays the complete table of exe-
cution path entries, starting from [start_index].
If [start_index] and [end_index] are not specified, the complete table of exe-
cution path entries is displayed.
For example:
(gdb) i ep 4 10
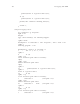
• info exec-path summary
Prints the summary information about all the local execution path entries in the
current frame. This command displays the total number of branches for the frame,
the number of branches executed in this frame in the last iteration, and the last
executed branch number.
• info global-exec-path [start_index] [end_index](aliased to info gep)
Lists all the global execution path entries for the current thread.
The [start_index] and [end_index] indicate the range of table indexes (execu-
tion path entries) that must be displayed.
If [end_index] is not specified, the debugger displays the complete table of exe-
cution path entries, starting from [start_index].
If [start_index] and [end_index] are not specified, the complete table of exe-
cution path entries is displayed.