
Debugging with GDB (September 2007)
152 Debugging with GDB
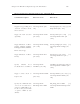
14.10.10.3 info heap arena [0 |1|2|..] blocks stacks
Displays the memory profile report for block level and overall memory usage with stack
trace where applicable.This command is available only for applications running on 11i
v3 or later.
14.10.10.4 info module ADDRESS
The info module command identifies load modules, and determines whether it lies
in the text or data region for a given address. This command is available only for
applications running on 11i v3 or later.
Syntax:
info module ADDRESS
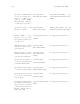
14.10.10.5 info heap process
The info heap process command enables the user to view a high level memory usage
report of a process. This command is available only for applications running on 11i v3
or later.
14.10.10.6 Example for heap profiling
This example shows how to use this feature on HP-UX 11.x:
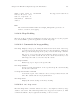
1. If the linker version is earlier than B.11.19, link with /opt/langtools/lib/pa20_
64/librtc.sl for PA-64 programs. For a 32-bit program, you must link w ith
‘/opt/langtools/lib/librtc.sl’.
If the dynamic linker version is B.11.19 or later, skip this step because WDB
automatically loads the ‘librtc.sl’ library.
2. Turn on profiling with the set heap-check on command:
(gdb) set heap-check on
3. Set a breakpoint:
(gdb) b myfunction
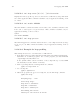
4. When the program is stopped at a breakpoint, use the info heap command:
(gdb) info heap
Analyzing heap ...done
Actual Heap Usage:
Heap Start = 0x40408000
Heap End = 0x4041a900
Heap Size = 76288 bytes
Outstanding Allocations:
41558 bytes allocated in 28 blocks