
Debugging with GDB (September 2007)
Chapter 14: HP-UX Configuration-Specific Information 151
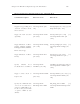
NULL pointer return by
memory allocators; used
with set heap-check on,
with/without null-check
enabled
catch nomem Not supp orted in batch mode
Note:
The files=<executable-name> and output_dir=<path> options are ex-
clusive to batch mode debugging.
14.10.10 Heap Profiling
The heap profile is useful for identifying how memory is being used by the program.
You can use WDB to profile an application’s current heap usage.
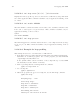
14.10.10.1 Commands for heap profiling
info heap Displays a heap report, listing information s uch as the start of the heap,
end of the heap, heap allocations, size of blocks, and number of instances.
The report shows heap usage at the point you use the info heap command.
The report does not show allocations that have already been freed. For
example, if you make several allocations, free them all, and then you use
info heap, the result does not show any allo cations.
info heap filename
Writes heap report output to the specified file.
info heap idnumber
Produces detailed information on the specified heap allocation including
the allocation call stack.
set heap-check frame-count num
Controls the depth of the call stack collected. Larger values increase run
time. The default value is four (4) stack frames.
show heap-check
Displays all current settings for memory checking.
14.10.10.2 info heap arena
The info heap arena command enables the user to view high level memory usage
details of each arena. The info heap arena is not supported in batch mode. This
command is available only for applications running on 11i v3 or later.