
Debugging with GDB Manual The GNU Source-Level Debugger (769148-001, March 2014)
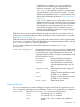

number, as shown in the first field of the 'info threads'
display. GDB responds by displaying the system identifier
of the thread you selected, and its current stack frame
summary:
((gdb)) thread 2
[Switching to thread 2 (system thread 26594)]
0x34e5 in sigpause ()
As with the '[New ...]' message, the form of the text after
'Switching to' depends on your system's conventions
for identifying threads.
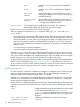
thread apply [threadno]
[all] args
The thread apply command allows you to apply a
command to one or more threads. Specify the numbers of
the threads that you want affected with the command
argument threadno. threadno is the internal GDB thread
number, as shown in the first field of the 'info threads'
display. To apply a command to all threads, use thread
apply all args.
Whenever GDB stops your program, due to a breakpoint or a signal, it automatically selects the
thread where that breakpoint or signal happened. GDB alerts you to the context switch with a
message of the form '[Switching to systag]' to identify the thread.
For more information about how GDB behaves when you stop and start programs with multiple
threads, see “Stopping and starting multi-thread programs” (page 48).
For information about watchpoints in programs with multiple threads, see “Killing the child process”
(page 32).
NOTE: On HP-UX 11.x, debugging a multi-thread process can cause a deadlock if the process
is waiting for an NFS-server response. A thread can be stopped while asleep in this state, and
NFS holds a lock on the rnode while asleep.
To prevent the thread from being interrupted while holding the rnode lock, make the NFS mount
non-interruptible with the '-nointr' flag. See mount(1).
Debugging programs with multiple processes
On most systems, GDB has no special support for debugging programs which create additional
processes using the fork function. When a program forks, GDB will continue to debug the parent
process and the child process will run unimpeded. If you have set a breakpoint in any code which
the child then executes, the child will get a SIGTRAP signal which (unless it catches the signal)
will cause it to terminate.
However, if you want to debug the child process there is a workaround which isn't too painful.
Put a call to sleep in the code which the child process executes after the fork. It may be useful to
sleep only if a certain environment variable is set, or a certain file exists, so that the delay need
not occur when you do not want to run GDB on the child. While the child is sleeping, use the ps
program to get its process ID. Then tell GDB (a new invocation of GDB if you are also debugging
the parent process) to attach to the child process (see “Debugging a Running Process” (page 31)).
From that point on you can debug the child process just like any other process which you attached
to.
On HP-UX (11.x and later only), GDB provides support for debugging programs that create
additional processes using the fork or vfork function.
By default, when a program forks, GDB will continue to debug the parent process and the child
process will run unimpeded.
If you want to follow the child process instead of the parent process, use the command set
follow-fork-mode.
34 Running Programs Under GDB