
Debugging with GDB Manual The GNU Source-Level Debugger (769148-001, March 2014)
Whenever GDB detects a new thread in your program, it displays the target system's identification
for the thread with a message in the form '[New systag]'. systag is a thread identifier whose
form varies depending on the particular system. For example, on LynxOS, you might see
[New process 35 thread 27]
when GDB notices a new thread. In contrast, on an SGI system, the systag is simply something
like 'process 368', with no further qualifier.
For debugging purposes, GDB associates its own thread number―always a single integer―with
each thread in your program.
info threads Display a summary of all threads currently in your program. GDB displays for
each thread (in this order):
1. the thread number assigned by GDB
2. the target system's thread identifier (systag)
3. the current stack frame summary for that thread
An asterisk '*' to the left of the GDB thread number indicates the current thread.
For example,
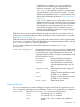
((gdb)) info threads
3 process 35 thread 27 0x34e5 in sigpause ()
2 process 35 thread 23 0x34e5 in sigpause ()
* 1 process 35 thread 13 main (argc=1, argv=0x7ffffff8)
at threadtest.c:68
On HP-UX systems:
For debugging purposes, GDB associates its own thread number―a small integer assigned in
thread-creation order―with each thread in your program.
Whenever GDB detects a new thread in your program, it displays both GDB's thread number and
the target system's identification for the thread with a message in the form '[New systag]'. systag
is a thread identifier whose form varies depending on the particular system. For example, on
HP-UX, you see
[New thread 2 (system thread 26594)]
when GDB notices a new thread.
Here are commands to get more information about threads:
info threads Display a summary of all threads currently in your program.
GDB displays for each thread (in this order):
1. the thread number assigned by GDB
2. the target system's thread identifier (systag)
3. the current stack frame summary for that thread
4. the priority of a thread
An asterisk '*' to the left of the GDB thread number indicates
the current thread.
For example,
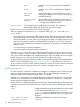
((gdb)) info threads
* 3 system thread 26607 worker (wptr=0x7b09c318
"@") \
at quicksort.c:137
2 system thread 26606 0x7b0030d8 in __ksleep ()
\
from /usr/lib/libc.2
1 system thread 27905 0x7b003498 in _brk () \
from /usr/lib/libc.2
thread threadno Make thread number threadno the current thread. The
command argument threadno is the internal GDB thread
Debugging programs with multiple threads 33