
Debugging with GDB Manual The GNU Source-Level Debugger (769148-001, March 2014)
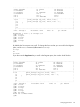
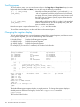
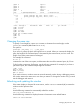
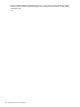
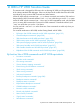
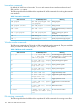
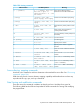
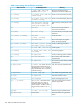
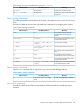
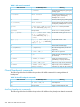

Table 6 Data viewing and modification commands (continued)
MeaningHP WDB EquivalentXDB Command
Evaluate static members of classNo equivalentpq class::
Evaluate next/previous memory location
using format
No equivalentpq {+ | -}[\format
Stack viewing commands
The GDB concept of the top and bottom of the stack is the opposite of XDB, so the XDB up is GDB
down.
The following table lists the XDB and equivalent WDB commands for viewing the stack contents:
Table 7 Stack viewing commands
MeaningHP WDB EquivalentXDB Command
View procedure one level nearer
outermost frame of stack (higher
number)
updown
View procedure number levels nearer
outermost frame of stack
up numberdown number
Print stack trace to deptht [depth] (with -xdb), bt
[depth]
t [depth]
Print stack trace and show local varsT [depth] (with -xdb), bt
full [depth]
T [depth]
View procedure at innermost frame of
stack
frame 0top
View procedure one level nearer
innermost frame of stack (lower number)
downup
View procedure number levels nearer
innermost frame of stack
down numberup number
Display text for current active procedure
or at specified depth on stack
V [depth] (with -xdb), frame
[depth]
V [depth]
Status-viewing command
Type the show command with no arguments to get a list of current debugger settings.
Table 8 Status viewing commands
MeaningHP WDB EquivalentXDB Command
Display state of debugger and programinfo (many kinds), show (many
kinds)
I
Job control commands
The following table lists the XDB and equivalent HP WDB commands for controlling program
execution:
By-function lists of XDB commands and HP WDB equivalents 199