
Debugging with GDB Manual The GNU Source-Level Debugger (769148-001, March 2014)
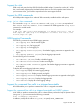
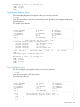

|29 int main(void) |
|30 { |
|31 /* Try two test cases. */ |
*>|32 print_average (my_list, first, last); |
|33 print_average (my_list, first, last - 3); |
|34 } |
|35 |
|36 |
|37 |
|38 |
|39 |
|----------------------------------------------------------------------|
File: average.c Procedure: main Line: 32 pc: 0x3524
..
(gdb) b main
Breakpoint 1 at 0x3524: file average.c, line 32.
(gdb) run
Starting program: /home/work/wdb/a.out
Breakpoint 1, main () at average.c:32
(gdb)
Automatically running a program at startup
HP WDB does not start running the target executable at startup as do `xdb' and HP DDE. This
makes it easy to set break points before the target program's main function.
To make HP WDB automatically start running the target program add these lines to your startup
file, .gdbinit:
break main
run
Screen Layouts
The TUI supports four panes within the terminal window, in various combinations:
• Command
• Source
• Disassembly
• Register
The Command pane is always present. The possible configurations of the other panes are:
• Source
• Disassembly
• Source/Disassembly
• Disassembly/Register
• Source/Register
The layout command (abbreviated la) enables you to change from one window configuration
to another.
NOTE: You can abbreviate any command to its shortest unambiguous form.
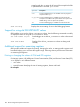
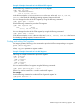
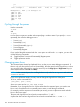
Source pane
The Source pane, Figure 1, appears by default when you invoke the debugger. You can also make
it appear by issuing the command
la src
Automatically running a program at startup 187