
Debugging with GDB Manual The GNU Source-Level Debugger (769148-001, March 2014)
CTRL-W +
to increase
CTRL-W -
to decrease
In Visual Interface for HP WDB, the current window is usually the debugger window.
Using commands to browse through source files
browse. For example, CTRL-B, CTRL-F, CTRL-D, CTRL-U are useful for browsing the debugger
window. These commands work whether or not you escape to `vi' mode. These `vim' commands
require you to escape to `vi' mode. For example:
`/' Search forward
`?' Search backward
`n' `N' Repeat search
`%' Match braces
`[[', `]]' Skip to the next procedure
`:line number' Go to any line number
All these commands require you to escape to `vi' command mode first. When you are done, type
a for append or i for insert or other `vi' commands to return to text insertion mode.
Or you can simply click the Prompt softkey.
Loading source files
Escape to `vi' command mode and use the :e command to load a source file.
:e filename
When the source files are located in multiple directories, you can simply specify the base name
alone as long as file names are unique and the appropriate dir commands have been executed.
Pressing the Prompt softkey takes you to the command prompt and also updates the source window
so that the cursor remains where the program is stopped.
Editing source files
To edit a file, kill the process then click the Edit button. If you do not kill the process, the source file
and binaries can get out of sync.
Editing the command line and command-line history
Visual Interface for HP WDB preserves the entire session's transactions so you can browse through
these at any time.
To edit the command line, press ESC to enter vi mode and then use vi commands. You can recall
previous commands in history by using [jk^P^N]. Complete command lines using TAB.
Saving the contents of a debugging session to a file
You can save the contents of the current debugging session, including debugger input/output and
program input/output to a file.
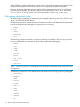
To save a session to a file:
1. Right-click an empty region of the source or debugger pane.
2. Choose "Save Session to vdb.pid" from the pop-up menu.
The debugger writes the input and output to a file whose name ends in the pid of the debugger.
If you save the session more than once, the new transactions are appended to the file.
180 HP-UX Configuration-Specific Information