
Debugging with GDB Manual The GNU Source-Level Debugger (769148-001, March 2014)
...
0x200000007aada000 - 0x200000007aada0e1 is segment24 (Added with mmapfile) ...
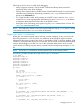
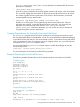
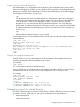
Next, add regions pointed to by t and u.
(gdb) p t
$9 = 0x60000000c1a91000 <Address 0x60000000c1a91000 out of bounds>
(gdb) mmapfile testfile 0x60000000c1a91000 0 0xe1
(gdb) p t
$10 = 0x60000000c1a91000 "#include <stdlib.h>\n#include <stdio.h>\nint main(){\n foo();\n bar();\n
return 0;\n}\nint foo(){\n int * res = malloc(4);\n printf(\"*res %d\\n\", *res);\n return 1;\n}\nint
bar(){\n printf(\"Hel"...
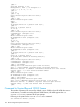
(gdb) p (t+0xd0)
$11 = 0x60000000c1a910d0 " return 2;\n}\n\n" <Address 0x60000000c1a910e1 out of bounds>
(gdb) p u
$12 = 0x60000000c4406000 <Address 0x60000000c4406000 out of bounds>
(gdb) mmapfile testfile2 0x60000000c4406000 0 0x100
(gdb) p u
$13 = 0x60000000c4406000 "\nSymtab for file ../../../../Src/gnu/gdb/testsuite/gdb.base/shlib31.c\nCompilation
directory is /view/kerch.vs.gdb/CLO/Components/WDB/build/ia64-hp-hpux-native/gdb/testsuite\nRead from object
file /view"...
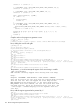
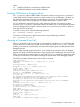
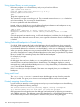
(gdb) i target
...
0x200000007aada000 - 0x200000007aada0e1 is segment24 (Added with mmapfile ‘testfile’) ---Type <return>
to continue, or q <return> to quit---
0x60000000c1a91000 - 0x60000000c1a910e1 is segment25 (Added with mmapfile ‘testfile’)
0x60000000c4406000 - 0x60000000c4406100 is segment26 (Added with mmapfile ‘testfile2’) ...
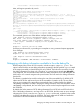
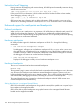
This command gives an error if the address overlaps already existing sections.
(gdb) mmapfile testfile 0x200000007aadc000 0 0x56
BFD: Error : The section (segment7) address overlaps with the
user given address range for mmapfile command. Use the
``info target'' command to display all the segments from the
core file.
mmapfile = testfile can not be added
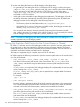
Specifying an unknown file, or providing an incomplete or wrong command reports appropriate
error messages.
(gdb) mmapfile xyz 0x60000000c1a91000 0 0xe1
mmapfile = xyz can not be opened (errno = 2)
(gdb) mmapfile testfile 0x60000000c1a91000
Usage:
mmapfile <FILENAME> <MAP-ADDRESS> <FILE-OFFSET> <LENGTH>
Debugging with debug information available in the side debug file
HP-UX/Integrity linker version B.12.56 onwards, includes an option +dbgfile <path>. This
option instructs the linker to emit debug information separately to the file specified in path, instead
of the target (executable or shared library) file as by default. The linker also records the name of
this debug information file, along with a checksum, in a special section named .gnu_debuglink,
in the target file. The rest of this document refers this debug information file as side debug file. HP
WDB version 6.2 onwards recognizes this special section and will read in the debug information
from the file.
This feature is intended to be used for reducing the size of the executable file. On HP-UX, ILP32
objects are ELF32 files and hence the size of the executable is limited to 4 GB. The new linker
emits an error message if the target file size exceeds this limit. For debug builds, the default
+objdebug compilation can help in keeping the debug information out of the executable. When
+objdebug is not preferred, this new linker option can be used to keep the target file size under
the 4 GB limit.
By default, the linker creates an ELF32 debug information file in ILP32 links and ELF64 for LP64
links. If the debug information is too large to fit in an ELF32 file, the linker emits an error message
indicating this. In such a case, the new +dbgfile <path> can be used, so that the linker creates
an ELF64 side debug file even for an ILP32 link. The newly enhanced HP WDB can handle this
combination of ELF32 executable file and ELF64 side debug file.
Debugging with debug information available in the side debug file 153