
Debugging with GDB Manual The GNU Source-Level Debugger (769148-001, March 2014)
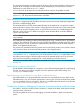
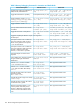

Table 1
DescriptionCommand
Enable/Disable the detection of open file descriptors.check_openfd=[on | off]
NOTE: This feature is currently supported only for batch-mode of memory debugging on HP
Integrity systems.
Configuring memory debugging settings
The following configuration settings are supported to control the level of details of information
required to be displayed when debugging memory leaks.
Specifying the stack depth
Memory debugging reduces the performance of an application by 20-40% because of stack
unwinding. To provide a clear profile of every allocation in the program, the debugger collects
the stack trace information for every allocation in the debugged application. Reducing the stack
depth (the number of stack frames that the debugger collects for each allocation) reduces the
performance degradation.
The set heap-check frame-count command enables you to control the depth of the stack
frames that are collected by HP WDB for each allocation. By default, four stack frames are displayed
from the allocating call stack.
To set the depth of the stack frames that is collected by HP WDB, enter the following command at
the gdb prompt:
$ set heap-check frame-count [num]
The stack depth, [num], is the number of stack frames that HP WDB collects for each allocation.
You can specify a higher value for [num] to view more stack frames for each reported allocation.
However, the performance of the application is reduced because of the increased stack depth.
Specifying minimum leak size
HP WDB enables you to specify the minimum leak size for stack trace collection to improve the
program's performance.
Stack trace collection slows down the program because it occurs on every allocation call. Therefore,
if the program is allocation-intensive, HP WDB can spend a substantial amount of time collecting
stack traces.
You can improve performance by using the command:
set heap-check min-leak-size num
For example, if you use,
set heap-check min-leak-size 100
HP WDB does not collect stack traces for allocations smaller than 100 bytes. HP WDB still reports
leaks smaller than this size, but does not include a stack trace.
Specifying minimum block size
The min-heap-size option reports the heap allocations that exceed the specified number <num>
of bytes based on the cumulative number of bytes that are allocated at each call-site, which is
inclusive of multiple calls to malloc at a particular call site. For example:
set heap-check min-heap-size 100
When the option min-heap-size is set to 100, GDB reports all the cumulative block allocations
that 100 bytes at each call-site.
Debugging Memory Problems 127