
Debugging with GDB Manual HP WDB v6.3 (5900-2180, August 2012)
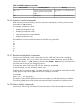
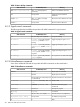
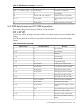
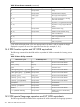
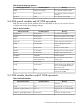
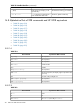
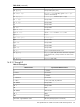
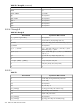
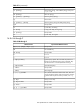
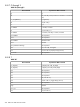

Table 14 Global breakpoint commands
MeaningHP WDB EquivalentXDB Command
Set or delete cmds to execute at every
stop
No exact equivalent, but display
expr is equivalent to abc print
expr
abc cmds
Stop displaying values at each stopundisplaydbc
16.2.6 Assertion control commands
GDB does not provide the ability to trace by instruction. Watchpoints, however, provide similar
functionality to xdb assertions.
For example, watchpoints can be:
• Enabled (corresponds to aa)
• Disabled (corresponds to da)
• Listed (corresponds to info watch)
• Added (corresponds to x)
HP WDB does not have explicit equivalents for the following commands:
a
aa
da
la
sa
ta
x
16.2.7 Record and playback commands
Use the source command to read commands from a file. GDB does not provide a recording
capability like XDB's, but you can use the set history save command to record all GDB
commands in the file ./.gdb_history (similar to the $HOME/.xdbhist file). The history file is
not saved until the end of your debugging session.
To change the name of the history file, use set history filename.
To stop recording, use set history save off.
To display the current history status, use show history. For an equivalent of the XDB record-all
facility, pipe the output of the gdb command to the tee(1) command.
For example:
gdb a.out | tee mylogfile
This solution works with the default line-mode user interface, not with the terminal user interface.
The following table lists the XDB and the equivalent HP WDB commands for handling macros:
16.2.8 Macro facility commands
Use the show user or help user-defined command to obtain a list of all user-defined commands.
16.2 Overall breakpoint commands 211