
Debugging with GDB Manual HP WDB v6.3 (5900-2180, August 2012)
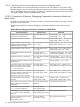
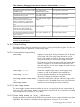

Table 2 Memory Debugging Commands in Interactive and Batch Mode (continued)
Batch modeInteractive modeCommand Description
Not supported in batch modeset heap-check
random-range <num>
Specifies the random range to be used by
random-range.
Not supported in batch modeset heap-check
interval <num>
Specifies the time interval to be used for
incremental memory profile.
Not supported in batch modeset heap-check repeat
<num>
Perform incremental profile for <num>
interval periods where each period
duration is defined by set heap-check
interval command. The default value is
100.
Not supported in batch modecatch nomemNULL pointer return by memory allocators;
used with set heap-check on,
with/without null-check enabled.
export RTC_PRINT_ADDR=1set print address onPrint hexadecimal addresses against the
function names shown in heap or leak
report stack trace.
NOTE: The files=<executable-name> and output_dir=<path> options are exclusive
to batch mode debugging.
14.10.11 Heap Profiling
The heap profile is useful for identifying how memory is being used by the program. You can use
HP WDB to profile an application's current heap usage.
14.10.11.1 Commands for heap profiling
info heap Displays a heap report, listing information such as the start
of the heap, end of the heap, heap allocations, size of
blocks, and number of instances. The report shows heap
usage at the point you use the info heap command.
The report does not show allocations that have already been
freed. For example, if you make several allocations, free
them all, and then you use info heap, the result does not
show any allocations.
info heap filename Writes the complete report output containing the heap
summary as well as the details to the specified file.
info heap idnumber Produces detailed information on the specified heap
allocation including the allocation call stack.
set heap-check frame-count
num
Controls the depth of the call stack collected. Larger values
increase run time. The default value is four (4) stack frames.
show heap-check Displays all current settings for memory checking.
14.10.11.2 info heap arena
The info heap arena command enables the user to view high level memory usage details of
each arena. The info heap arena is not supported in batch mode. This command is available
only for applications running on 11i v3 or later.
14.10.11.3 info heap arena [0 |1|2|..] blocks stacks
Displays the memory profile report for block level and overall memory usage with stack trace where
applicable. This command is available only for applications running on 11i v3 or later.
14.10 Debugging Memory Problems 137