
Debugging with GDB Manual HP WDB v6.3 (5900-2180, August 2012)

NOTE:
• From HP WDB 5.7 onwards, the archive version of the run time check library, librtc.a, is
not available. You must use the shared version of the library, librtc.[sl|so], instead.
• From HP WDB Version 6.3 and later, you can configure rtcconfig file in attach mode
along with batch mode.
14.10.7 Open-files reporting
From version 6.2 onwards, HP WDB enables you to obtain a report containing a list of file
descriptors corresponding to files open by the application at the point of its exit. The report not
only provides you the names and types of those files, but also details such as backtraces and
function names at the point of the files being opened. This enables you to identify potential file
descriptor leaks in the application.
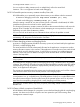
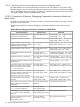
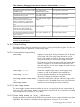
Table 1
DescriptionCommand
Enable/Disable the detection of open file descriptors.check_openfd=[on | off]
NOTE: This feature is currently supported only for batch-mode of memory debugging on HP
Integrity systems.
14.10.8 Configuring memory debugging settings
The following configuration settings are supported to control the level of details of information
required to be displayed when debugging memory leaks.
14.10.8.1 Specifying the stack depth
Memory debugging reduces the performance of an application by 20-40% because of stack
unwinding. To provide a clear profile of every allocation in the program, the debugger collects
the stack trace information for every allocation in the debugged application. Reducing the stack
depth (the number of stack frames that the debugger collects for each allocation) reduces the
performance degradation.
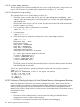
The set heap-check frame-count command enables you to control the depth of the stack
frames that are collected by HP WDB for each allocation. By default, four stack frames are displayed
from the allocating call stack.
To set the depth of the stack frames that is collected by HP WDB, enter the following command at
the gdb prompt:
$ set heap-check frame-count [num]
The stack depth, [num], is the number of stack frames that HP WDB collects for each allocation.
You can specify a higher value for [num] to view more stack frames for each reported allocation.
However, the performance of the application is reduced because of the increased stack depth.
14.10.8.2 Specifying minimum leak size
HP WDB enables you to specify the minimum leak size for stack trace collection to improve the
program's performance.
Stack trace collection slows down the program because it occurs on every allocation call. Therefore,
if the program is allocation-intensive, HP WDB can spend a substantial amount of time collecting
stack traces.
You can improve performance by using the command:
set heap-check min-leak-size num
14.10 Debugging Memory Problems 133