
Debugging with GDB Manual HP WDB v6.3 (5900-2180, August 2012)
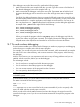
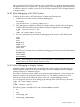
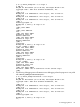

(gdb) print USED1
100
(gdb) print USED1+10
110
(gdb) info macro USED1
Defined at scope.c:4
#define USED1 100
(gdb) info macro USED2
The macro `USED2' has no definition in the current scope.
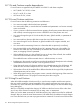
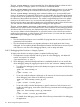
(gdb) c
Continuing.
Breakpoint 2, main () at scope.c:23
23 val = USED1 + USED2;
(gdb) info macro USED1
Defined at scope.c:20
#define USED1 101
(gdb) info macro USED2
Defined at scope.c:21
#define USED2 201
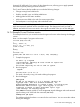
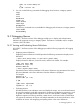
(gdb) c
Continuing.
Breakpoint 3, main () at scope.c:30
30 val = USED1;
(gdb) info macro USED1
Defined at scope.c:28
#define USED1 102
(gdb) info macro USED2
The macro `USED2' has no definition in the current scope.
(gdb) q
The program is running. Exit anyway? (y or n) y.
14.10 Debugging Memory Problems
You can use HP WDB to find leaks, profile heap usage and detect other heap-related errors in HP
C, HP aC++, and HP Fortran programs written for HP-UX 11.x systems. (Both 32-bit and 64-bit
programs are supported.)
On HP-UX 11.x, the memory debugging features of HP WDB work with both single-threaded and
multi-threaded programs that use POSIX threads.
For more information on memory debugging with HP WDB, see the Debugging Dynamic Memory
Usage Errors Using HP WDB whitepaper at the HP WDB Documentation webpage at: http://
www.hp.com/go/wdb.
14.10.1 When to suspect a memory leak
You should suspect a memory leak in the code when you notice that the system is running out of
swap space or running slower, or both.
Applications or non-kernel code (including daemons) that have memory leaks can eventually use
up all swap space. You can run top(1) to verify whether the process data space (SIZE, RES) is
growing more than you expect.
If the system is running out of swap space, programs will fail with out-of-memory (ENOMEM) errors
or SIGBUS signals. In addition, the system might run slower and slower until it comes to a stop;
all processes requiring swap to continue running will wait for it indefinitely. GDB allows you to
catch out-of-memory conditions through runtime memory checking. Use the command catch
nomem to detect out-of-memory conditions. GDB will stop whenever malloc returns NULL and allows
you to look at the current context.
120 HP-UX Configuration-Specific Information