
Debugging with GDB (February 2008)
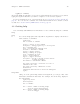
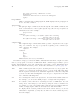

Table Of Contents
- Summary of GDB
- A Sample GDB Session
- Getting In and Out of GDB
- GDB Commands
- Running Programs Under GDB
- Stopping and Continuing
- Examining the Stack
- Examining Source Files
- Examining Data
- Using GDB with Different Languages
- Examining the Symbol Table
- Altering Execution
- GDB Files
- Specifying a Debugging Target
- HP-UX Configuration-Specific Information
- Summary of HP Enhancements to GDB
- HP-UX dependencies
- Supported Platforms and Modes
- HP-UX targets
- Support for Alternate root
- Specifying object file directories
- Fix and continue debugging
- Inline Support
- Debugging Macros
- Debugging Memory Problems
- When to suspect a memory leak
- Memory debugging restrictions
- Memory Debugging Methodologies
- Debugging Memory in Interactive Mode
- Debugging Memory in Batch Mode
- Debugging Memory Interactively After Attaching to a Running Process
- Configuring memory debugging settings
- Scenarios in memory debugging
- Stop when freeing unallocated or deallocated blocks
- Stop when freeing a block if bad writes occurred outside block boundary
- Stop when a specified block address is allocated or deallocated
- Scramble previous memory contents at malloc/free calls
- Detect dangling pointers and dangling blocks
- Detect in-block corruption of freed blocks
- Specify the amount of guard bytes for every block of allocated memory
- Comparison of Memory Debugging Commands in Interactive Mode and Batch Mode
- Heap Profiling
- Memory Checking Analysis for User Defined Memory Management Routines
- Commands to track the change in data segment value
- Thread Debugging Support
- Debugging MPI Programs
- Debugging multiple processes ( programs with fork and vfork calls)
- Debugging Core Files
- Printing the Execution Path Entries for the Current Frame or Thread
- Invoking GDB Before a Program Aborts
- Aborting a Command Line Call
- Instruction Level Stepping
- Enhanced support for watchpoints and breakpoints
- Debugging support for shared libraries
- Language support
- Enhanced Java Debugging Support
- Commands for Examining Java Virtual Machine(JVM) internals
- Support for stack traces in Java, C, and C++ programs
- Support for 64-bit Java, C, aC++ stack unwinding
- Enhanced support for C++ templates
- Support for __fpreg data type on IPF
- Support for _Complex variables in HP C
- Support for debugging namespaces
- Command for evaluating the address of an expression
- Viewing Wide Character Strings
- Support for output logging
- Getting information from a non-debug executable
- Debugging optimized code
- Visual Interface for WDB
- Starting and stopping Visual Interface for WDB
- Navigating the Visual Interface for WDB display
- Specifying foreground and background colors
- Using the X-window graphical interface
- Using the TUI mode
- Changing the size of the source or debugger pane
- Using commands to browse through source files
- Loading source files
- Editing source files
- Editing the command line and command-line history
- Saving the contents of a debugging session to a file
- Support for ddd
- Support for XDB commands
- GNU GDB Logging Commands
- Support for command line calls in a stripped executable
- Displaying the current block scope information
- Linux support
- The HP-UX Terminal User Interface
- XDB to WDB Transition Guide
- By-function lists of XDB commands and HP WDB equivalents
- Overall breakpoint commands
- XDB data formats and HP WDB equivalents
- XDB location syntax and HP WDB equivalents
- XDB special language operators and HP WDB equivalents
- XDB special variables and HP WDB equivalents
- XDB variable identifiers and HP WDB equivalents
- Alphabetical lists of XDB commands and HP WDB equivalents
- Controlling GDB
- Canned Sequences of Commands
- Using GDB under gnu Emacs
- GDB Annotations
- The gdb/mi Interface
- Function and purpose
- Notation and terminology
- gdb/mi Command Syntax
- gdb/mi compatibility with CLI
- gdb/mi output records
- gdb/mi command description format
- gdb/mi breakpoint table commands
- gdb/mi Data manipulation
- gdb/mi program control
- Miscellaneous GDB commands in gdb/mi
- gdb/mi Stack Manipulation Commands
- gdb/mi Symbol query commands
- gdb/mi Target Manipulation Commands
- gdb/mi thread commands
- gdb/mi tracepoint commands
- gdb/mi variable objects
- Reporting Bugs in GDB
- Installing GDB
- Index
Chapter 4: Running Programs Under GDB 25
set args Specify the arguments to be used the next time your program is run. If set
args has no arguments, run executes your program with no arguments. Once
you have run your program with arguments, using set args before the next
run is the only way to run it again without arguments.
show args Show the arguments to give your program when it is started.
4.4 Program Environment
The environment consists of a set of environment variables and their values. Envi-
ronment variables conventionally record information such as your user name, your home
directory, your terminal type, and your search path for programs to run. Usually you set
up environment variables with the shell and they are inherited by all the other programs
you run. When debugging, it can be useful to try running your program with a modified
environment without having to start GDB over again.
show envvar
List all the environment variables used by GDB.
show paths
Display the list of search paths for executables (the PATH environment variable).
show environment [varname ]
Print the value of environment variable varname to be given to your program
when it starts. If you do not supply varname, print the names and values of
all environment variables to be given to your program. You can abbreviate
environment as env.
set environment varname [=value]
Set environment variable varname to value. The value changes for your program
only, not for GDB itself. The value may be any string; the values of environment
variables are just strings, and any interpretation is supplied by your program
itself. The value parameter is optional; if it is eliminated, the variable is set to
a null value.
For example, this command:
set env USER = foo
tells the debugged program, when subsequently run, that its user is named
‘foo’. (The spaces around ‘=’ are used for clarity here; they are not actually
required.)
unset environment varname
Remove variable varname from the environment to be passed to your program.
This is different from ‘set env varname =’; unset environment removes the
variable from the environment, rather than assigning it an empty value.
path directory
Add directory to the front of the PATH environment variable (the search path
for executables), for both GDB and your program. You may specify several
directory names, separated by whitespace or by a system-dependent separator