
Debugging with GDB (February 2008)
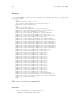
Table Of Contents
- Summary of GDB
- A Sample GDB Session
- Getting In and Out of GDB
- GDB Commands
- Running Programs Under GDB
- Stopping and Continuing
- Examining the Stack
- Examining Source Files
- Examining Data
- Using GDB with Different Languages
- Examining the Symbol Table
- Altering Execution
- GDB Files
- Specifying a Debugging Target
- HP-UX Configuration-Specific Information
- Summary of HP Enhancements to GDB
- HP-UX dependencies
- Supported Platforms and Modes
- HP-UX targets
- Support for Alternate root
- Specifying object file directories
- Fix and continue debugging
- Inline Support
- Debugging Macros
- Debugging Memory Problems
- When to suspect a memory leak
- Memory debugging restrictions
- Memory Debugging Methodologies
- Debugging Memory in Interactive Mode
- Debugging Memory in Batch Mode
- Debugging Memory Interactively After Attaching to a Running Process
- Configuring memory debugging settings
- Scenarios in memory debugging
- Stop when freeing unallocated or deallocated blocks
- Stop when freeing a block if bad writes occurred outside block boundary
- Stop when a specified block address is allocated or deallocated
- Scramble previous memory contents at malloc/free calls
- Detect dangling pointers and dangling blocks
- Detect in-block corruption of freed blocks
- Specify the amount of guard bytes for every block of allocated memory
- Comparison of Memory Debugging Commands in Interactive Mode and Batch Mode
- Heap Profiling
- Memory Checking Analysis for User Defined Memory Management Routines
- Commands to track the change in data segment value
- Thread Debugging Support
- Debugging MPI Programs
- Debugging multiple processes ( programs with fork and vfork calls)
- Debugging Core Files
- Printing the Execution Path Entries for the Current Frame or Thread
- Invoking GDB Before a Program Aborts
- Aborting a Command Line Call
- Instruction Level Stepping
- Enhanced support for watchpoints and breakpoints
- Debugging support for shared libraries
- Language support
- Enhanced Java Debugging Support
- Commands for Examining Java Virtual Machine(JVM) internals
- Support for stack traces in Java, C, and C++ programs
- Support for 64-bit Java, C, aC++ stack unwinding
- Enhanced support for C++ templates
- Support for __fpreg data type on IPF
- Support for _Complex variables in HP C
- Support for debugging namespaces
- Command for evaluating the address of an expression
- Viewing Wide Character Strings
- Support for output logging
- Getting information from a non-debug executable
- Debugging optimized code
- Visual Interface for WDB
- Starting and stopping Visual Interface for WDB
- Navigating the Visual Interface for WDB display
- Specifying foreground and background colors
- Using the X-window graphical interface
- Using the TUI mode
- Changing the size of the source or debugger pane
- Using commands to browse through source files
- Loading source files
- Editing source files
- Editing the command line and command-line history
- Saving the contents of a debugging session to a file
- Support for ddd
- Support for XDB commands
- GNU GDB Logging Commands
- Support for command line calls in a stripped executable
- Displaying the current block scope information
- Linux support
- The HP-UX Terminal User Interface
- XDB to WDB Transition Guide
- By-function lists of XDB commands and HP WDB equivalents
- Overall breakpoint commands
- XDB data formats and HP WDB equivalents
- XDB location syntax and HP WDB equivalents
- XDB special language operators and HP WDB equivalents
- XDB special variables and HP WDB equivalents
- XDB variable identifiers and HP WDB equivalents
- Alphabetical lists of XDB commands and HP WDB equivalents
- Controlling GDB
- Canned Sequences of Commands
- Using GDB under gnu Emacs
- GDB Annotations
- The gdb/mi Interface
- Function and purpose
- Notation and terminology
- gdb/mi Command Syntax
- gdb/mi compatibility with CLI
- gdb/mi output records
- gdb/mi command description format
- gdb/mi breakpoint table commands
- gdb/mi Data manipulation
- gdb/mi program control
- Miscellaneous GDB commands in gdb/mi
- gdb/mi Stack Manipulation Commands
- gdb/mi Symbol query commands
- gdb/mi Target Manipulation Commands
- gdb/mi thread commands
- gdb/mi tracepoint commands
- gdb/mi variable objects
- Reporting Bugs in GDB
- Installing GDB
- Index
Chapter 21: The gdb/mi Interface 289
nr-rows nr-cols [ aschar ]
where:
‘address ’ An expression specifying the address of the first memory word to be read.
Complex expressions containing embedded white space should be quoted using
the C convention.
‘word-format ’
The format to be used to print the memory words. The notation is the same
as for GDB print command (see Section 8.4 [Output formats], page 66).
‘word-size ’
The size of each memory word in bytes.
‘nr-rows ’ The number of rows in the output table.
‘nr-cols ’ The number of columns in the output table.
‘aschar ’ If present, indicates that each row should include an ascii dump. The value
of aschar is used as a padding character when a byte is not a member of the
printable ascii character set (printable ascii characters are those whose code
is between 32 and 126, inclusively).
‘byte-offset ’
An offset to add to the address before fetching memory.
This command displays memory contents as a table of nr-rows by nr-cols words, each
word being word-size bytes. In total, nr-rows * nr-cols * word-size bytes are read
(returned as ‘total-bytes’). Should less than the requested number of bytes be returned
by the target, the missing words are identified using ‘N/A’. The number of bytes read from
the target is returned in ‘nr-bytes’ and the starting address used to read memory in ‘addr’.
The address of the next/previous row or page is available in ‘next-row’ and ‘prev-row’,
‘next-page’ and ‘prev-page’.
GDB command
The corresponding GDB command is ‘x’. gdbtk has ‘gdb_get_mem’ memory read com-
mand.
Example
Read six bytes of memory starting at bytes+6 but then offset by -6 bytes. Format as
three rows of two columns. One byte per word. Display each word in hex.
(gdb)
9-data-read-memory -o -6 -- bytes+6 x 1 3 2
9^done,addr="0x00001390",nr-bytes="6",total-bytes="6",
next-row="0x00001396",prev-row="0x0000138e",next-page="0x00001396",
prev-page="0x0000138a",memory=[
{addr="0x00001390",data=["0x00","0x01"]},
{addr="0x00001392",data=["0x02","0x03"]},
{addr="0x00001394",data=["0x04","0x05"]}]
(gdb)