
Debugging with GDB (February 2008)

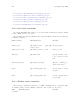
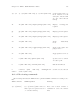
Table Of Contents
- Summary of GDB
- A Sample GDB Session
- Getting In and Out of GDB
- GDB Commands
- Running Programs Under GDB
- Stopping and Continuing
- Examining the Stack
- Examining Source Files
- Examining Data
- Using GDB with Different Languages
- Examining the Symbol Table
- Altering Execution
- GDB Files
- Specifying a Debugging Target
- HP-UX Configuration-Specific Information
- Summary of HP Enhancements to GDB
- HP-UX dependencies
- Supported Platforms and Modes
- HP-UX targets
- Support for Alternate root
- Specifying object file directories
- Fix and continue debugging
- Inline Support
- Debugging Macros
- Debugging Memory Problems
- When to suspect a memory leak
- Memory debugging restrictions
- Memory Debugging Methodologies
- Debugging Memory in Interactive Mode
- Debugging Memory in Batch Mode
- Debugging Memory Interactively After Attaching to a Running Process
- Configuring memory debugging settings
- Scenarios in memory debugging
- Stop when freeing unallocated or deallocated blocks
- Stop when freeing a block if bad writes occurred outside block boundary
- Stop when a specified block address is allocated or deallocated
- Scramble previous memory contents at malloc/free calls
- Detect dangling pointers and dangling blocks
- Detect in-block corruption of freed blocks
- Specify the amount of guard bytes for every block of allocated memory
- Comparison of Memory Debugging Commands in Interactive Mode and Batch Mode
- Heap Profiling
- Memory Checking Analysis for User Defined Memory Management Routines
- Commands to track the change in data segment value
- Thread Debugging Support
- Debugging MPI Programs
- Debugging multiple processes ( programs with fork and vfork calls)
- Debugging Core Files
- Printing the Execution Path Entries for the Current Frame or Thread
- Invoking GDB Before a Program Aborts
- Aborting a Command Line Call
- Instruction Level Stepping
- Enhanced support for watchpoints and breakpoints
- Debugging support for shared libraries
- Language support
- Enhanced Java Debugging Support
- Commands for Examining Java Virtual Machine(JVM) internals
- Support for stack traces in Java, C, and C++ programs
- Support for 64-bit Java, C, aC++ stack unwinding
- Enhanced support for C++ templates
- Support for __fpreg data type on IPF
- Support for _Complex variables in HP C
- Support for debugging namespaces
- Command for evaluating the address of an expression
- Viewing Wide Character Strings
- Support for output logging
- Getting information from a non-debug executable
- Debugging optimized code
- Visual Interface for WDB
- Starting and stopping Visual Interface for WDB
- Navigating the Visual Interface for WDB display
- Specifying foreground and background colors
- Using the X-window graphical interface
- Using the TUI mode
- Changing the size of the source or debugger pane
- Using commands to browse through source files
- Loading source files
- Editing source files
- Editing the command line and command-line history
- Saving the contents of a debugging session to a file
- Support for ddd
- Support for XDB commands
- GNU GDB Logging Commands
- Support for command line calls in a stripped executable
- Displaying the current block scope information
- Linux support
- The HP-UX Terminal User Interface
- XDB to WDB Transition Guide
- By-function lists of XDB commands and HP WDB equivalents
- Overall breakpoint commands
- XDB data formats and HP WDB equivalents
- XDB location syntax and HP WDB equivalents
- XDB special language operators and HP WDB equivalents
- XDB special variables and HP WDB equivalents
- XDB variable identifiers and HP WDB equivalents
- Alphabetical lists of XDB commands and HP WDB equivalents
- Controlling GDB
- Canned Sequences of Commands
- Using GDB under gnu Emacs
- GDB Annotations
- The gdb/mi Interface
- Function and purpose
- Notation and terminology
- gdb/mi Command Syntax
- gdb/mi compatibility with CLI
- gdb/mi output records
- gdb/mi command description format
- gdb/mi breakpoint table commands
- gdb/mi Data manipulation
- gdb/mi program control
- Miscellaneous GDB commands in gdb/mi
- gdb/mi Stack Manipulation Commands
- gdb/mi Symbol query commands
- gdb/mi Target Manipulation Commands
- gdb/mi thread commands
- gdb/mi tracepoint commands
- gdb/mi variable objects
- Reporting Bugs in GDB
- Installing GDB
- Index
Chapter 16: XDB to WDB Transition Guide 213
16 XDB to WDB Transition Guide
This transition aid is designed for XDB users who are learning WDB, an HP-supported
version of the industry-standard GDB debugger. Select one of these lists for a table that
shows WDB equivalents for many common XDB commands and other features.
Invoke WDB with the command gdb -tui to obtain a terminal user interface (TUI)
similar to that provided by XDB. Commands marked "(with -tui)" are valid when you use
the -tui option.
Invoke WDB with the command gdb -xdb to turn on XDB compatibility mode, which
enables you to use many XDB commands as synonyms for GDB commands. Commands
marked "(with -xdb)" are valid when you use the -xdb option.
You may use both -xdb and -tui at the same time. Some commands are valid only
when you use both options.
For a tutorial introduction to WDB, refer to the Getting Started with WDB.
• Section 16.1 [By-Function Lists of XDB Commands and HP WDB Equivalents],
page 213.
• Section 16.2 [XDB Data Formats and HP WDB Equivalents], page 221.
• Section 16.3 [XDB Data Formats and HP WDB Equivalents], page 228.
• Section 16.4 [XDB Location Syntax and HP WDB Equivalents], page 230.
• Section 16.5 [XDB Special Language Operators and HP WDB Equivalents], page 231.
• Section 16.6 [XDB Special Variables and HP WDB Equivalents], page 232.
• Section 16.7 [XDB Variable Identifiers and HP WDB Equivalents], page 233.
• Section 16.8 [Alphabetical Lists of XDB Commands and HP WDB Equivalents],
page 233.
16.1 By-function lists of XDB commands and HP WDB
equivalents
• Section 16.1.1 [Invocation Commands], page 214.
• Section 16.1.2 [Window Mode Commands], page 214.
• Section 16.1.3 [File Viewing Commands], page 215.
• Section 16.1.4 [Source Directory Mapping Commands], page 217.
• Section 16.1.5 [Data Viewing and Modification Commands], page 217.
• Section 16.1.6 [Stack Viewing Commands], page 219.
• Section 16.1.7 [Status Viewing Command], page 219.
• Section 16.1.8 [Job Control Commands], page 220.
• Section 16.2 [Overall Breakpoint Commands], page 221.
• Section 16.2.1 [Auxiliary Breakpoint Commands], page 221.
• Section 16.2.2 [Breakpoint Creation Commands], page 222.
• Section 16.2.3 [Breakpoint Status Commands], page 223.
• Section 16.2.4 [All-Procedures Breakpoint Commands], page 224.