
Debugging with GDB (February 2008)
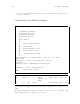
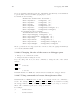
Table Of Contents
- Summary of GDB
- A Sample GDB Session
- Getting In and Out of GDB
- GDB Commands
- Running Programs Under GDB
- Stopping and Continuing
- Examining the Stack
- Examining Source Files
- Examining Data
- Using GDB with Different Languages
- Examining the Symbol Table
- Altering Execution
- GDB Files
- Specifying a Debugging Target
- HP-UX Configuration-Specific Information
- Summary of HP Enhancements to GDB
- HP-UX dependencies
- Supported Platforms and Modes
- HP-UX targets
- Support for Alternate root
- Specifying object file directories
- Fix and continue debugging
- Inline Support
- Debugging Macros
- Debugging Memory Problems
- When to suspect a memory leak
- Memory debugging restrictions
- Memory Debugging Methodologies
- Debugging Memory in Interactive Mode
- Debugging Memory in Batch Mode
- Debugging Memory Interactively After Attaching to a Running Process
- Configuring memory debugging settings
- Scenarios in memory debugging
- Stop when freeing unallocated or deallocated blocks
- Stop when freeing a block if bad writes occurred outside block boundary
- Stop when a specified block address is allocated or deallocated
- Scramble previous memory contents at malloc/free calls
- Detect dangling pointers and dangling blocks
- Detect in-block corruption of freed blocks
- Specify the amount of guard bytes for every block of allocated memory
- Comparison of Memory Debugging Commands in Interactive Mode and Batch Mode
- Heap Profiling
- Memory Checking Analysis for User Defined Memory Management Routines
- Commands to track the change in data segment value
- Thread Debugging Support
- Debugging MPI Programs
- Debugging multiple processes ( programs with fork and vfork calls)
- Debugging Core Files
- Printing the Execution Path Entries for the Current Frame or Thread
- Invoking GDB Before a Program Aborts
- Aborting a Command Line Call
- Instruction Level Stepping
- Enhanced support for watchpoints and breakpoints
- Debugging support for shared libraries
- Language support
- Enhanced Java Debugging Support
- Commands for Examining Java Virtual Machine(JVM) internals
- Support for stack traces in Java, C, and C++ programs
- Support for 64-bit Java, C, aC++ stack unwinding
- Enhanced support for C++ templates
- Support for __fpreg data type on IPF
- Support for _Complex variables in HP C
- Support for debugging namespaces
- Command for evaluating the address of an expression
- Viewing Wide Character Strings
- Support for output logging
- Getting information from a non-debug executable
- Debugging optimized code
- Visual Interface for WDB
- Starting and stopping Visual Interface for WDB
- Navigating the Visual Interface for WDB display
- Specifying foreground and background colors
- Using the X-window graphical interface
- Using the TUI mode
- Changing the size of the source or debugger pane
- Using commands to browse through source files
- Loading source files
- Editing source files
- Editing the command line and command-line history
- Saving the contents of a debugging session to a file
- Support for ddd
- Support for XDB commands
- GNU GDB Logging Commands
- Support for command line calls in a stripped executable
- Displaying the current block scope information
- Linux support
- The HP-UX Terminal User Interface
- XDB to WDB Transition Guide
- By-function lists of XDB commands and HP WDB equivalents
- Overall breakpoint commands
- XDB data formats and HP WDB equivalents
- XDB location syntax and HP WDB equivalents
- XDB special language operators and HP WDB equivalents
- XDB special variables and HP WDB equivalents
- XDB variable identifiers and HP WDB equivalents
- Alphabetical lists of XDB commands and HP WDB equivalents
- Controlling GDB
- Canned Sequences of Commands
- Using GDB under gnu Emacs
- GDB Annotations
- The gdb/mi Interface
- Function and purpose
- Notation and terminology
- gdb/mi Command Syntax
- gdb/mi compatibility with CLI
- gdb/mi output records
- gdb/mi command description format
- gdb/mi breakpoint table commands
- gdb/mi Data manipulation
- gdb/mi program control
- Miscellaneous GDB commands in gdb/mi
- gdb/mi Stack Manipulation Commands
- gdb/mi Symbol query commands
- gdb/mi Target Manipulation Commands
- gdb/mi thread commands
- gdb/mi tracepoint commands
- gdb/mi variable objects
- Reporting Bugs in GDB
- Installing GDB
- Index
194 Debugging with GDB
2. Choose "Save Session to vdb.pid" from the pop-up menu.
The debugger writes the input and output to a file whose name ends in the pid
of the debugger. If you save the session more than once, the new transactions are
appended to the file.
14.27 Support for ddd
GDB works with ddd, the free GDB GUI shell available at http://mumm.ibr.cs.tu-bs.de/.
While this is not formally supported by Hewlett-Packard, these two do work together.
Note however if you have ddd issues, you’ll need to report them to the ddd support
channel.
14.28 Support for XDB commands
HP WDB provides support for a subset of XDB commands, enabled with the -xdb
option.
14.28.1 stop in/at dbx commands
The commands <stop in function/address> and <stop at line> are equivalent of
dbx <break function/address /line> command. WDB supports the <stop in/at>
command in non-dbx mode.
For example:
$ gdb a.out (gdb) stop in main Breakpoint 1 at 0x2a34: file list.c, line 18
from /tmp/a.out (gdb) stop at 25 Breakpoint 2 at 0x2a6c: file list.c, line
25 from /tmp/a.out (gdb)
14.29 GNU GDB Logging Commands
The following commands control GDB logging activities:
• set logging file: Set the current log file
• set logging off: Set logging off
• set logging on: Set logging on
• set logging overwrite[on|off]: Set whether logging overwrites or appends to
the log file.
• set logging redirect [on|off]: Set the logging output mode
14.30 Support for command line calls in a stripped
executable
HP WDB enables you to perform command line calls in a stripped executable.