
Debugging with GDB (February 2008)
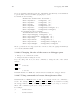
Table Of Contents
- Summary of GDB
- A Sample GDB Session
- Getting In and Out of GDB
- GDB Commands
- Running Programs Under GDB
- Stopping and Continuing
- Examining the Stack
- Examining Source Files
- Examining Data
- Using GDB with Different Languages
- Examining the Symbol Table
- Altering Execution
- GDB Files
- Specifying a Debugging Target
- HP-UX Configuration-Specific Information
- Summary of HP Enhancements to GDB
- HP-UX dependencies
- Supported Platforms and Modes
- HP-UX targets
- Support for Alternate root
- Specifying object file directories
- Fix and continue debugging
- Inline Support
- Debugging Macros
- Debugging Memory Problems
- When to suspect a memory leak
- Memory debugging restrictions
- Memory Debugging Methodologies
- Debugging Memory in Interactive Mode
- Debugging Memory in Batch Mode
- Debugging Memory Interactively After Attaching to a Running Process
- Configuring memory debugging settings
- Scenarios in memory debugging
- Stop when freeing unallocated or deallocated blocks
- Stop when freeing a block if bad writes occurred outside block boundary
- Stop when a specified block address is allocated or deallocated
- Scramble previous memory contents at malloc/free calls
- Detect dangling pointers and dangling blocks
- Detect in-block corruption of freed blocks
- Specify the amount of guard bytes for every block of allocated memory
- Comparison of Memory Debugging Commands in Interactive Mode and Batch Mode
- Heap Profiling
- Memory Checking Analysis for User Defined Memory Management Routines
- Commands to track the change in data segment value
- Thread Debugging Support
- Debugging MPI Programs
- Debugging multiple processes ( programs with fork and vfork calls)
- Debugging Core Files
- Printing the Execution Path Entries for the Current Frame or Thread
- Invoking GDB Before a Program Aborts
- Aborting a Command Line Call
- Instruction Level Stepping
- Enhanced support for watchpoints and breakpoints
- Debugging support for shared libraries
- Language support
- Enhanced Java Debugging Support
- Commands for Examining Java Virtual Machine(JVM) internals
- Support for stack traces in Java, C, and C++ programs
- Support for 64-bit Java, C, aC++ stack unwinding
- Enhanced support for C++ templates
- Support for __fpreg data type on IPF
- Support for _Complex variables in HP C
- Support for debugging namespaces
- Command for evaluating the address of an expression
- Viewing Wide Character Strings
- Support for output logging
- Getting information from a non-debug executable
- Debugging optimized code
- Visual Interface for WDB
- Starting and stopping Visual Interface for WDB
- Navigating the Visual Interface for WDB display
- Specifying foreground and background colors
- Using the X-window graphical interface
- Using the TUI mode
- Changing the size of the source or debugger pane
- Using commands to browse through source files
- Loading source files
- Editing source files
- Editing the command line and command-line history
- Saving the contents of a debugging session to a file
- Support for ddd
- Support for XDB commands
- GNU GDB Logging Commands
- Support for command line calls in a stripped executable
- Displaying the current block scope information
- Linux support
- The HP-UX Terminal User Interface
- XDB to WDB Transition Guide
- By-function lists of XDB commands and HP WDB equivalents
- Overall breakpoint commands
- XDB data formats and HP WDB equivalents
- XDB location syntax and HP WDB equivalents
- XDB special language operators and HP WDB equivalents
- XDB special variables and HP WDB equivalents
- XDB variable identifiers and HP WDB equivalents
- Alphabetical lists of XDB commands and HP WDB equivalents
- Controlling GDB
- Canned Sequences of Commands
- Using GDB under gnu Emacs
- GDB Annotations
- The gdb/mi Interface
- Function and purpose
- Notation and terminology
- gdb/mi Command Syntax
- gdb/mi compatibility with CLI
- gdb/mi output records
- gdb/mi command description format
- gdb/mi breakpoint table commands
- gdb/mi Data manipulation
- gdb/mi program control
- Miscellaneous GDB commands in gdb/mi
- gdb/mi Stack Manipulation Commands
- gdb/mi Symbol query commands
- gdb/mi Target Manipulation Commands
- gdb/mi thread commands
- gdb/mi tracepoint commands
- gdb/mi variable objects
- Reporting Bugs in GDB
- Installing GDB
- Index
Chapter 14: HP-UX Configuration-Specific Information 189
• Start the process in one terminal and attach to it with Visual Interface
for WDB.
• Use the ‘tty’ command at the debugger prompt so the program’s input
and output are directed to another terminal.
Note: if the underlying GDB terminates abnormally when you are using
Visual Interface for WDB, do not close the Visual Interface for WDB win-
dow. Wait for a minute or two. Visual Interface for WDB captures the
stack trace and the debugging session details and sends you an email. You
can then forward this to HP when you report the problem. This is helpful
to HP in reconstructing the crash scenario.
14.26.1 Starting and stopping Visual Interface for WDB
You can use Visual Interface for WDB in either of two modes:
• X-window-based graphical interface: Supports mouse and keyboard commands.
• Terminal interface: Supports keyboard commands only.
Visual Interface for WDB accepts the same command line arguments as GDB so you
can add options to the startup command. See the man page for GDB for the list of
arguments.
• To start Visual Interface for WDB in graphical mode with mouse support, run
Visual Interface for WDB with the command:
/opt/langtools/bin/vdb
• To start Visual Interface for WDB in terminal user interface mode, run Visual
Interface for WDB with the command:
/opt/langtools/bin/vdb -tui
• To stop Visual Interface for WDB, type quit on the WDB command line:
(wdb) quit
14.26.2 Navigating the Visual Interface for WDB display
The Visual Interface for WDB window consists of two areas:
• Source pane at the top
• Debugger pane at the bottom
You can use the arrow and pagination keys on the keyboard to move the cursor:
• Pagination keys move the cursor in the source window, at the top, above the status
line.
• Holding the shift key down while using the pagination keys moves the cursor in
the debugger window.
• The up and down arrow keys move the cursor in the source window.
• Holding the shift key down while using the up and down arrow keys move the
cursor in the debugger window.
• The left and right arrow keys move the cursor in the debugger window.