
Debugging with GDB (February 2008)
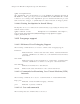
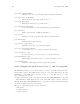
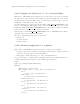
Table Of Contents
- Summary of GDB
- A Sample GDB Session
- Getting In and Out of GDB
- GDB Commands
- Running Programs Under GDB
- Stopping and Continuing
- Examining the Stack
- Examining Source Files
- Examining Data
- Using GDB with Different Languages
- Examining the Symbol Table
- Altering Execution
- GDB Files
- Specifying a Debugging Target
- HP-UX Configuration-Specific Information
- Summary of HP Enhancements to GDB
- HP-UX dependencies
- Supported Platforms and Modes
- HP-UX targets
- Support for Alternate root
- Specifying object file directories
- Fix and continue debugging
- Inline Support
- Debugging Macros
- Debugging Memory Problems
- When to suspect a memory leak
- Memory debugging restrictions
- Memory Debugging Methodologies
- Debugging Memory in Interactive Mode
- Debugging Memory in Batch Mode
- Debugging Memory Interactively After Attaching to a Running Process
- Configuring memory debugging settings
- Scenarios in memory debugging
- Stop when freeing unallocated or deallocated blocks
- Stop when freeing a block if bad writes occurred outside block boundary
- Stop when a specified block address is allocated or deallocated
- Scramble previous memory contents at malloc/free calls
- Detect dangling pointers and dangling blocks
- Detect in-block corruption of freed blocks
- Specify the amount of guard bytes for every block of allocated memory
- Comparison of Memory Debugging Commands in Interactive Mode and Batch Mode
- Heap Profiling
- Memory Checking Analysis for User Defined Memory Management Routines
- Commands to track the change in data segment value
- Thread Debugging Support
- Debugging MPI Programs
- Debugging multiple processes ( programs with fork and vfork calls)
- Debugging Core Files
- Printing the Execution Path Entries for the Current Frame or Thread
- Invoking GDB Before a Program Aborts
- Aborting a Command Line Call
- Instruction Level Stepping
- Enhanced support for watchpoints and breakpoints
- Debugging support for shared libraries
- Language support
- Enhanced Java Debugging Support
- Commands for Examining Java Virtual Machine(JVM) internals
- Support for stack traces in Java, C, and C++ programs
- Support for 64-bit Java, C, aC++ stack unwinding
- Enhanced support for C++ templates
- Support for __fpreg data type on IPF
- Support for _Complex variables in HP C
- Support for debugging namespaces
- Command for evaluating the address of an expression
- Viewing Wide Character Strings
- Support for output logging
- Getting information from a non-debug executable
- Debugging optimized code
- Visual Interface for WDB
- Starting and stopping Visual Interface for WDB
- Navigating the Visual Interface for WDB display
- Specifying foreground and background colors
- Using the X-window graphical interface
- Using the TUI mode
- Changing the size of the source or debugger pane
- Using commands to browse through source files
- Loading source files
- Editing source files
- Editing the command line and command-line history
- Saving the contents of a debugging session to a file
- Support for ddd
- Support for XDB commands
- GNU GDB Logging Commands
- Support for command line calls in a stripped executable
- Displaying the current block scope information
- Linux support
- The HP-UX Terminal User Interface
- XDB to WDB Transition Guide
- By-function lists of XDB commands and HP WDB equivalents
- Overall breakpoint commands
- XDB data formats and HP WDB equivalents
- XDB location syntax and HP WDB equivalents
- XDB special language operators and HP WDB equivalents
- XDB special variables and HP WDB equivalents
- XDB variable identifiers and HP WDB equivalents
- Alphabetical lists of XDB commands and HP WDB equivalents
- Controlling GDB
- Canned Sequences of Commands
- Using GDB under gnu Emacs
- GDB Annotations
- The gdb/mi Interface
- Function and purpose
- Notation and terminology
- gdb/mi Command Syntax
- gdb/mi compatibility with CLI
- gdb/mi output records
- gdb/mi command description format
- gdb/mi breakpoint table commands
- gdb/mi Data manipulation
- gdb/mi program control
- Miscellaneous GDB commands in gdb/mi
- gdb/mi Stack Manipulation Commands
- gdb/mi Symbol query commands
- gdb/mi Target Manipulation Commands
- gdb/mi thread commands
- gdb/mi tracepoint commands
- gdb/mi variable objects
- Reporting Bugs in GDB
- Installing GDB
- Index
184 Debugging with GDB
To execute the steplast command in C++ compiled applications, you must compile
the application using the HP aC++ version A.03.50 or later with the -g0 option.
In C++, the steplast command is helpful while debugging heavy templated functions,
because it directly steps into the call, thus skipping the constructor calls, if any. This
behavior is unlike the step command that steps into the constructor itself.
Consider the following example:
void call_me ( string s ) ... (gdb)
10
call_me ( "hello" );
(gdb) steplast call_me (s=static npos = 4294967295,
static nullref = ref_hdr = mutex_= dummy1 = 0x7f4f79e0, dummy2 = 2136325568,
refs_ = 2136327612,
capacity_ = 2136327468, nchars_ = 2136327464, eos_char = 64 ’@’,
alloc_ = <No data fields>,
value_allocator = alloc_ = 0x7f7f133c,
data_ = 0x40003a64 "hello") at str.C:55
printf ("Will just print the value of \n");
If there are multiple top-level calls, the steplast command enables you to step into
each top-level call. For example, for the following line, the steplast command takes
you to the first top-level call, (foo()):
foo(bar()) + bar(foo());
Debug foo(), use the finish command to exit from the first top-level call, (foo()),
execute the steplast command to step into the next top-level call, (bar()). The
following example illustrates the use of steplast command:
(gdb)10 foo( bar() ) + bar( foo() ) (gdb) sl Use the steplast (sl) command to
step
14.24 Getting information from a non-debug executable
You can get some information about the arguments passed to the functions displayed
in the stack trace in a non-debug, optimized executable.
When GDB has no debug information; it does not know where the arguments are
located or even the type of the arguments. GDB cannot infer this in an optimized,
non-debug executable.
However, for integer arguments you can find the first few parameters for the top-of-
stack frame by looking at the registers. On PA-RISC systems, the first parameter will
be in $r26, the second in $r25 and so on. On IPF systems, the first few parameters
will be in $gr32 and $gr33.
14.25 Debugging optimized code
HP WDB supports debugging of optimized code (compiled with both -g and -O) for
HP aC++, HP ANSI C and HP WDB for HP Itanium.