
Debugging with GDB (February 2008)
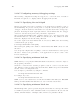
Table Of Contents
- Summary of GDB
- A Sample GDB Session
- Getting In and Out of GDB
- GDB Commands
- Running Programs Under GDB
- Stopping and Continuing
- Examining the Stack
- Examining Source Files
- Examining Data
- Using GDB with Different Languages
- Examining the Symbol Table
- Altering Execution
- GDB Files
- Specifying a Debugging Target
- HP-UX Configuration-Specific Information
- Summary of HP Enhancements to GDB
- HP-UX dependencies
- Supported Platforms and Modes
- HP-UX targets
- Support for Alternate root
- Specifying object file directories
- Fix and continue debugging
- Inline Support
- Debugging Macros
- Debugging Memory Problems
- When to suspect a memory leak
- Memory debugging restrictions
- Memory Debugging Methodologies
- Debugging Memory in Interactive Mode
- Debugging Memory in Batch Mode
- Debugging Memory Interactively After Attaching to a Running Process
- Configuring memory debugging settings
- Scenarios in memory debugging
- Stop when freeing unallocated or deallocated blocks
- Stop when freeing a block if bad writes occurred outside block boundary
- Stop when a specified block address is allocated or deallocated
- Scramble previous memory contents at malloc/free calls
- Detect dangling pointers and dangling blocks
- Detect in-block corruption of freed blocks
- Specify the amount of guard bytes for every block of allocated memory
- Comparison of Memory Debugging Commands in Interactive Mode and Batch Mode
- Heap Profiling
- Memory Checking Analysis for User Defined Memory Management Routines
- Commands to track the change in data segment value
- Thread Debugging Support
- Debugging MPI Programs
- Debugging multiple processes ( programs with fork and vfork calls)
- Debugging Core Files
- Printing the Execution Path Entries for the Current Frame or Thread
- Invoking GDB Before a Program Aborts
- Aborting a Command Line Call
- Instruction Level Stepping
- Enhanced support for watchpoints and breakpoints
- Debugging support for shared libraries
- Language support
- Enhanced Java Debugging Support
- Commands for Examining Java Virtual Machine(JVM) internals
- Support for stack traces in Java, C, and C++ programs
- Support for 64-bit Java, C, aC++ stack unwinding
- Enhanced support for C++ templates
- Support for __fpreg data type on IPF
- Support for _Complex variables in HP C
- Support for debugging namespaces
- Command for evaluating the address of an expression
- Viewing Wide Character Strings
- Support for output logging
- Getting information from a non-debug executable
- Debugging optimized code
- Visual Interface for WDB
- Starting and stopping Visual Interface for WDB
- Navigating the Visual Interface for WDB display
- Specifying foreground and background colors
- Using the X-window graphical interface
- Using the TUI mode
- Changing the size of the source or debugger pane
- Using commands to browse through source files
- Loading source files
- Editing source files
- Editing the command line and command-line history
- Saving the contents of a debugging session to a file
- Support for ddd
- Support for XDB commands
- GNU GDB Logging Commands
- Support for command line calls in a stripped executable
- Displaying the current block scope information
- Linux support
- The HP-UX Terminal User Interface
- XDB to WDB Transition Guide
- By-function lists of XDB commands and HP WDB equivalents
- Overall breakpoint commands
- XDB data formats and HP WDB equivalents
- XDB location syntax and HP WDB equivalents
- XDB special language operators and HP WDB equivalents
- XDB special variables and HP WDB equivalents
- XDB variable identifiers and HP WDB equivalents
- Alphabetical lists of XDB commands and HP WDB equivalents
- Controlling GDB
- Canned Sequences of Commands
- Using GDB under gnu Emacs
- GDB Annotations
- The gdb/mi Interface
- Function and purpose
- Notation and terminology
- gdb/mi Command Syntax
- gdb/mi compatibility with CLI
- gdb/mi output records
- gdb/mi command description format
- gdb/mi breakpoint table commands
- gdb/mi Data manipulation
- gdb/mi program control
- Miscellaneous GDB commands in gdb/mi
- gdb/mi Stack Manipulation Commands
- gdb/mi Symbol query commands
- gdb/mi Target Manipulation Commands
- gdb/mi thread commands
- gdb/mi tracepoint commands
- gdb/mi variable objects
- Reporting Bugs in GDB
- Installing GDB
- Index
Chapter 14: HP-UX Configuration-Specific Information 139
check_free=on|off (or) set heap-check free <on/off>
Enables detection of multiple incorrect free of memory
check_heap|heap=on|off (or) set heap-check <on/off>
Enables heap profiling.
check_leaks|leaks=on|off (or) set heap-check leaks <on/off>
Enables leak detection.
check_string=on|off (or) set heap-check string <on/off>
Enables detection for writing out of boundary for strcpy, strncpy, memcpy,
memccpy, memset, memmove, bzero, bcopy.
check_bounds|bounds=on|off (or) set heap-check bounds <on/off>
Enables checking of bounds corruption.
files=<file1:file2:...|fileN>
Specifies the executables for which memory leak detection is enabled. if files
option is not specified, after setting BATCH_RTC=on, RTC will instrument ALL
executables.
frame_count=no_frames (or) set heap-check frame-count <no_frames>
Sets the number of frames to be printed for leak context.
min_heap_size=block_size (or) set heap-check min-heap-size <block_size>
Sets the minimum block size to use for heap reporting.
min_leak_size=block_size (or) set heap-check min-leak-size <block_size>
Sets the minimum block size to use for leak detection.
output_dir=output_data_dir
Species the name of the output data directory.
scramble_blocks=on|off (or) set heap-check scramble <on/off>
Enables block scrambling.
Batch mode leak detection stops the application at the end, when libraries are being
unloaded, and invokes HP WDB to print the leak or heap data.
Note:
It is incorrect usage to use spaces before or after the ’=’ symbol in the batch
mode configuration options in the configuration file, rtcconfig. Additionally,
it is incorrect usage to use spaces before the batch mode configuration options.
For example:
Correct Usage:
$ cat rtcconfig
check_leaks=on
check_heap=on
files=batchrtc4
$
Incorrect Usage: