
Debugging Dynamic Memory Usage Errors Using HP WDB
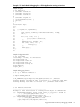
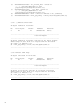
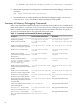

Table 15 Commonly Used Commands for Memory Debugging (continued)
Batch ModeInteractive Mode/Attach ModeDescription
Not supported in Batch Mode
catch nomem
Enables the user to gain control over
an out-of-memory event. The user can
step through program execution after
the nomem event is detected.
Not supported in Batch Mode
set heap-check seed-value
<num>
Defines the seed-value for random
number calculation for the set
heap-check null-check random
command
Not supported in Batch Mode
set heap-check random-range
<num>
Forces malloc() to return NULL
after random number of invocations
of malloc()
Not supported in Batch Mode
set heap-check reset
This command resets the data existing
in the file for incremental profiling
and creates a new data file. The old
data in the file is erased.
Not supported in Batch Mode
set heap-check interval
<num>
Starts the incremental heap growth
profile. All allocations prior to the
execution of this command are
ignored. If incremental heap growth
profile is already on, executing this
command resets the counters and
starts a fresh collection. The interval
is specified in seconds.
Not supported in Batch Mode
set heap-check repeat <num>
Enables you to specify the number of
intervals for which WDB must collect
the incremental heap growth. The
default value is 100. Every repeat of
the interval tracks heap allocation
during that interval.
Not supported in Batch Mode
info heap interval
Creates a detailed report of the heap
growth. The data for each interval has
the start and end time of the interval.
Not supported in Batch Mode
set heap-check
high-mem-count <X_number>
Stops when break value has moved
<X_number> times
Not supported in Batch Mode
info heap high-mem
Displays the number of times break
value changes for a given run
Not supported in Batch Mode
info heap <process|arenas>
Displays the high level
memory-usage of a process or an
arena. Lists the number of free blocks,
used blocks, small blocks, holding
blocks, node blocks and regular
blocks.
Debugging Memory Using WDB GUI
The WDB GUI is a Graphical User Interface (GUI) designed by Hewlett-Packard for WDB. It can
be used to debug native-compiled HP C, HP aC++, and Fortran programs on Itanium-based
systems running HP-UX 11i v2 or HP-UX 11i v3, and PA-RISC systems running HP-UX 11.0,
HP-UX 11i v1, HP-UX 11i v2, or HP-UX 11i v3.
The WDB GUI offers the following capabilities to debug memory–related errors in an application
• Detects corruption caused by calls to strcpy(), memset(), and memcopy()
• Stops program-execution at free of an unallocated or de-allocated block address
• Stops program-execution when block is freed if bad writes occur before or after block bounds
Debugging Memory Using WDB GUI 65