
Debugging Dynamic Memory Usage Errors Using HP WDB


Settings to Manage Performance Degradation.
Memory-debugging slows down the performance of an application by 20-40% because of stack
unwinding. Reducing the number of stack frames the debugger collects for each allocation reduces
the performance degradation.
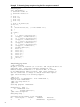
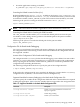
Table 12 lists the options for reducing the performance degradation.
Table 12 Options for Performance Improvement
DescriptionCommandSetting
Controls the depth of the call stack. By
default, num is set to 4.
set heap-check frame-count
<num>
Stack Depth
Specifies the minimum leak size for
stack trace collection. The debugger
continues to report leaks that are
smaller than <num> bytes, but it does
not provide the stack trace for the
same. By default, num is set to 0.
set heap-check min-leak-size
<num>
Minimum Leak Size
Supported Modes of Memory-debugging in WDB
WDB supports the following modes of memory-debugging:
• Interactive Mode
• Batch Mode
• Attach Mode
Debugging in the Interactive Mode
The interactive mode of memory-debugging is typically useful during the development and
defect fixing phase, where you need the flexibility to control the flow of program execution while
debugging memory related problems.
To debug your program in the interactive mode, complete the following steps:
1. Compile the source files with the —g option. No special compilation of link options are
required.
The program must be linked with shared libc.[so|sl]. Memory-checking features do
not work on the programs linked with archived libc.a
$ aCC –g <source filename> –o <executable>
2. To activate the memory debugging, perform either of the following:
• Invoke WDB with the -leaks option as follows:
$ gdb -leaks <executable>
This enables leak checking. To enable other memory debugging features you must use
the appropriate set of commands.
• Alternatively, enter the following command at the gdb prompt:
$ gdb <executable>
(gdb)set heap-check on
This enables leaks checking, bounds checking, and check for double-frees.
3. Place breakpoints at probe points by entering the following command:
(gdb)b <probe_point>
Settings to Manage Performance Degradation. 55