
Debugging Dynamic Memory Usage Errors Using HP WDB


Breakpoint 1, main () at high.c:40
40 };
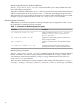
(gdb) info heap high-mem
Analyzing heap ...
High memory mark stat
High water mark updated count: 2
No. Total bytes Blocks Address Function
0 100 1 0x4044ff20 func2()
(gdb)
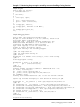
Case 2: The set heap-check high-mem-count <X_number> command stops execution
when the break value has moved <X_number> of times.
$ gdb high
HP gdb 5.6 for HP Itanium (32 or 64 bit) and target HP-UX 11.2x.
Copyright 1986 - 2001 Free Software Foundation, Inc.
Hewlett-Packard Wildebeest 5.5.8 (based on GDB) is covered
by the GNU General Public License. Type "show copying" to
see the conditions to change it and/or distribute copies.
Type "show warranty" for warranty/support.
..
(gdb) set heap-check on
(gdb) set heap-check high-mem-count 2
(gdb) r
Starting program: high
warning: High water mark
(address = 0x4044ff00 total memory per call site = 100)
#1 func2() at high.c:15
#2 main() at high.c:40
#3 main_opd_entry() from
warning: Use command backtrace (bt) to see the current context.
Ignore top 4 frames belonging to leak detection library of gdb.
__rtc_event (ecode=RTC_NO_ERROR, pointer=0x0, pclist=0x0, size=0)
at ../../../Src/gnu/gdb/infrtc.c:1236
1236 {
Memory-Debugging Features of WDB 45